Ammonia toxicity degrades animal health, growth
An excess of ammonia can lead to adverse physiological consequences, mortalities
Ammonia nitrogen consisting of un-ionized ammonia (NH3) and ammonium ion (NH4+) occurs in waters of aquaculture production systems as a waste product of protein metabolism by aquatic animals and degradation of organic matter by bacteria and other microorganisms. Ammonia nitrogen also reaches ponds in nitrogen fertilizers such as ammonium sulfate, ammonium phosphate and urea that hydrolyze to produce ammonia nitrogen.
The proportion of ammonia nitrogen existing as NH3 increases as water temperature and especially pH increase (Table 1). Salinity decreases the proportion of NH3 at a given pH and temperature, but the effect is not great. For example, at pH 8 and 25 degrees C, the contributions of un-ionized ammonia nitrogen (NH3-N) to ammonia nitrogen at different salinities are: freshwater, 4.90 percent; 5 ppt salinity, 4.93 percent; 10 ppt, 4.78 percent; 15 ppt, 4.63 percent; 20 ppt, 4.48 percent; 25 ppt, 4.34 percent; 30 ppt, 4.20 percent; 35 ppt, 4.07 percent.
Boyd, Decimal fractions of ammonia nitrogen, Table 1
| Temperature (° C) pH | Temperature (° C) 16 | Temperature (° C) 18 | Temperature (° C) 20 | Temperature (° C) 22 | Temperature (° C) 24 | Temperature (° C) 26 | Temperature (° C) 28 | Temperature (° C) 30 | Temperature (° C) 32 |
|---|---|---|---|---|---|---|---|---|---|
| 7.2 | 0.004 | 0.005 | 0.006 | 0.007 | 0.008 | 0.009 | 0.011 | 0.012 | 0.015 |
| 7.6 | 0.011 | 0.013 | 0.015 | 0.017 | 0.020 | 0.023 | 0.027 | 0.031 | 0.036 |
| 8.0 | 0.028 | 0.033 | 0.038 | 0.043 | 0.049 | 0.057 | 0.065 | 0.075 | 0.087 |
| 8.4 | 0.069 | 0.079 | 0.090 | 0.103 | 0.117 | 0.132 | 0.149 | 0.169 | 0.194 |
| 8.8 | 0.157 | 0.178 | 0.200 | 0.223 | 0.248 | 0.276 | 0.306 | 0.339 | 0.377 |
| 9.2 | 0.319 | 0.352 | 0.386 | 0.420 | 0.454 | 0.489 | 0.526 | 0.563 | 0.603 |
Most of the waste nitrogen in aquatic animals is transported in the blood to the gills, where it diffuses into the water as NH3. When NH3 concentration is low in the surrounding water, there is a high concentration gradient to facilitate loss of ammonia from animal blood to the water. An increase of NH3 in the water decreases the gradient, resulting in a higher concentration of NH3 in the blood and leading to adverse physiological consequences that can be lethal if the NH3 concentration becomes excessive.

Toxicity of ammonia nitrogen
The toxicity of ammonia nitrogen to aquatic animals results almost entirely from NH3, because NH4+ is relatively non-toxic. Thus, NH3 toxicity is highly dependent upon pH and is more likely in waters with pH above 8. Of course, in pond culture, water pH typically fluctuates daily, with lowest values in the early morning hours and highest values in the afternoon. In some weakly buffered, low-alkalinity waters with dense phytoplankton blooms, and in high-alkalinity waters, pH can be high throughout the day.
There has been much research on ammonia toxicity to aquaculture species under controlled conditions in the laboratory. Toxicity data have commonly been reported as the concentration of ammonia (reported as NH3-N) lethal to 50 percent of the test organisms (LC50). The duration of tests have varied, but many were for 96 hours. Typical 96-hour LC50s found in the literature are presented in Table 2 for several aquaculture species.
Boyd, Examples of 96-hour LC50s for NH3-N, Table 2
| Species | 96-Hour LC50 |
|---|---|
| Freshwater | |
| Channel catfish | 0.74-3.10 |
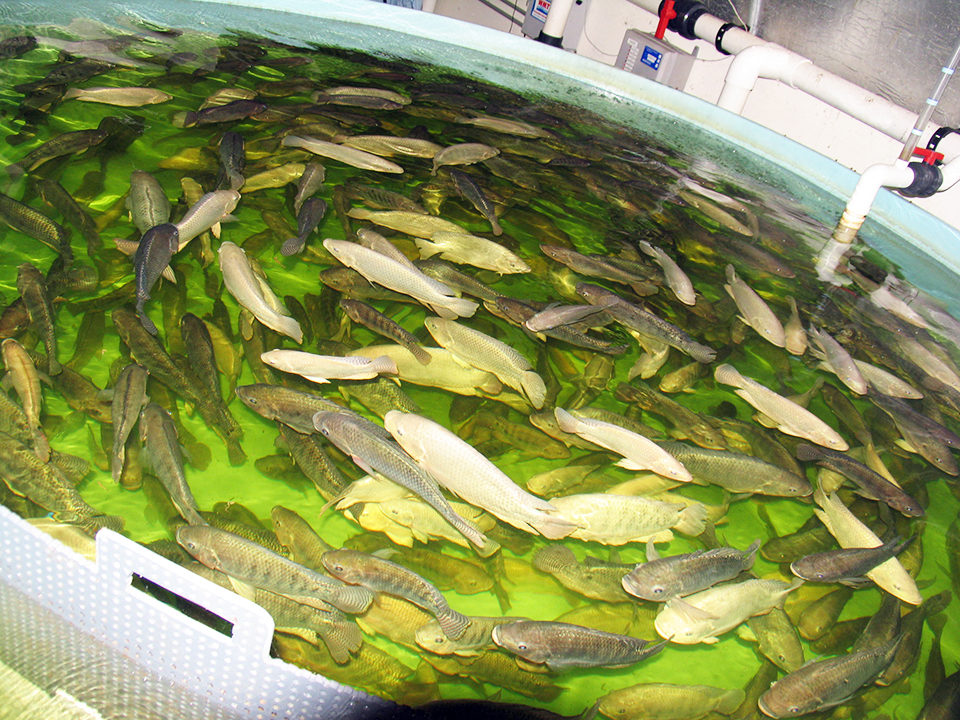
| Tilapia | 2.88 |
| Rainbow trout | 0.32-0.93 |
| Cutthroat trout | 0.50-0.80 |
| Fathead minnows | 0.20-3.4 |
| Freshwater prawns | 2.00-2.50 |
| Marine | |
| Striped bass | 0.64-1.10 |
| Spotted sea trout | 1.72 |
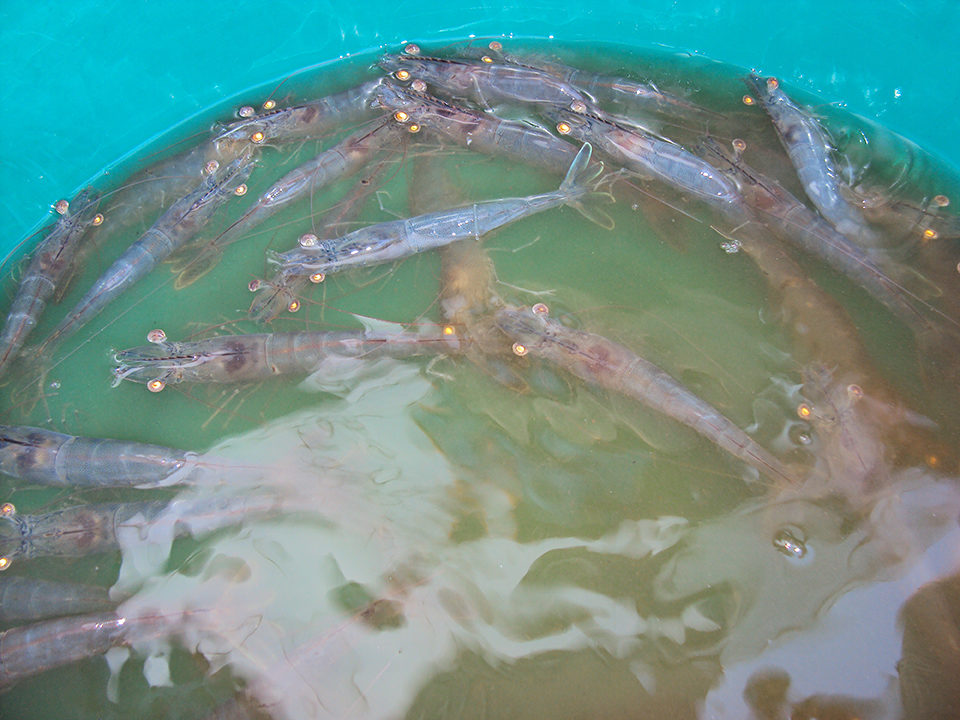
| Southern white shrimp | 0.69-1.20 |
| Pacific white shrimp | 1.20-2.95 |
| Black tiger prawns | 1.04-1.69 |
| School prawns | 1.39 |
The LC50s for NH3 typically are less than 1.0 mg/L for coldwater species and 1.0-3.0 mg/L for warmwater species. There is not much difference in the 96-hour LC50 range for freshwater and marine species. Some of the reported variation in LC50s resulted from species differences in susceptibility to ammonia. However, much of the variation was the result of different conditions in the toxicity tests – especially water temperature, pH and salinity.
A study on rainbow trout reported LC50s of 0.32-0.66 mg/L at temperatures of 10 to 13 degrees C, but at 16 to 19 degrees C, LC50s were 0.86-0.93 mg/L. This revealed that NH3 was more toxic at lower temperature. This is somewhat unusual, because the LC50s of many toxins decrease with increasing water temperature, indicating greater toxicity in warmer water.
The pH is not only important in determining the percentage of ammonia nitrogen in NH3 form, it also affects the toxicity of NH3. In a study of channel catfish, the LC50 at pH 6.0 was 0.74 mg/L, but at pH 8.8 was 1.91 mg/L. In rainbow trout, the LC50 increased from 0.13 mg/L at pH 6.5 to 0.66 mg/L at pH 8.9. Although there is a smaller proportion of NH3 at lower pH, NH3 is more toxic at lower pH.
Increasing salinity lessens the toxicity of NH3. In Pacific white shrimp, the LC50 increased from 1.2 mg/L at 15 ppt salinity to 1.6 mg/L at 35 ppt salinity. Similar results were reported for other species of shrimp and fish. The effect of dissolved-oxygen concentration on NH3 toxicity is unclear. One study did not find an effect, but another study revealed that NH3 was more toxic to black tiger prawns at a dissolved-oxygen concentration of 2.3 mg/L than at 5.7 mg/L.
Sub-lethal effects
In aquaculture, producers are usually more concerned over sub-lethal effects of a toxin than about the LC50. A number of studies have revealed that chronic exposure to NH3 produces physiological changes, causes gill lesions, reduces growth and increases susceptibility to diseases.
A study with channel catfish found that growth decreased linearly over the NH3-N concentration range of 0.048-0.989 mg/L. Growth reduction was 50 percent at 0.517 mg/L, and no growth occurred at the highest concentration. Tilapia growth also was shown to decline progressively at NH3-N concentrations above 0.068 mg/L.
An NH3-N concentration of 0.45 mg/L reduced the growth of each of five species of penaeid shrimp by about 50 percent. Rainbow trout exposed continuously to NH3-N concentrations up to 0.073 mg/L did not show reduction in growth, but histopathological lesions were noted at 0.04 mg/L, and protozoan infections increased above 0.02 mg/L.
Most toxicity studies were conducted at relatively constant concentrations of NH3-N. In culture systems, and especially in ponds, the NH3-N concentration varies with time of day and depth. For example, in a freshwater pond, the pH might be 7.4 in the early morning, when water temperature is 26 degrees C, and 8.8 in the afternoon, when the water temperature is 28 degrees C. At an ammonia-nitrogen concentration of 1.0 mg/L, the NH3-N concentration in the morning would be 0.015 mg/L, but in the afternoon, the concentration would be 0.306 mg/L – 20 times greater.
Nevertheless, daily fluctuations of NH3-N up to 0.37 mg/L that occurred in ponds did not cause a measurable decline in tilapia growth. The authors of that study concluded that exposure to sub-lethal ammonia concentrations probably has minimal effects on fish growth.
Fish and shrimp exposed earlier to sub-lethal NH3 concentrations were less affected by high NH3 nitrogen concentration than were animals not previously exposed. Ammonia-nitrogen concentrations tend to increase over time in culture systems as biomass and feed input increase. This may allow the culture species to acclimate to greater ammonia-nitrogen concentrations.
Safe concentrations
The safe concentration for long-term exposure to NH3-N and several other common toxins often is estimated by multiplying 0.1 or 0.05 times the 96-hour LC50. Using 0.05 as the factor, safe NH3-N concentrations would range 0.015-0.045 mg/L for coldwater species and 0.050-0.150 mg/L for warmwater species.
Because of the great variations in NH3-N concentrations, pH and water temperature over time, however, these calculations should be considered more as general guidelines than absolute values. Frequent, repeated monitoring of NH3-N in culture systems – especially in ponds – is therefore not necessary.
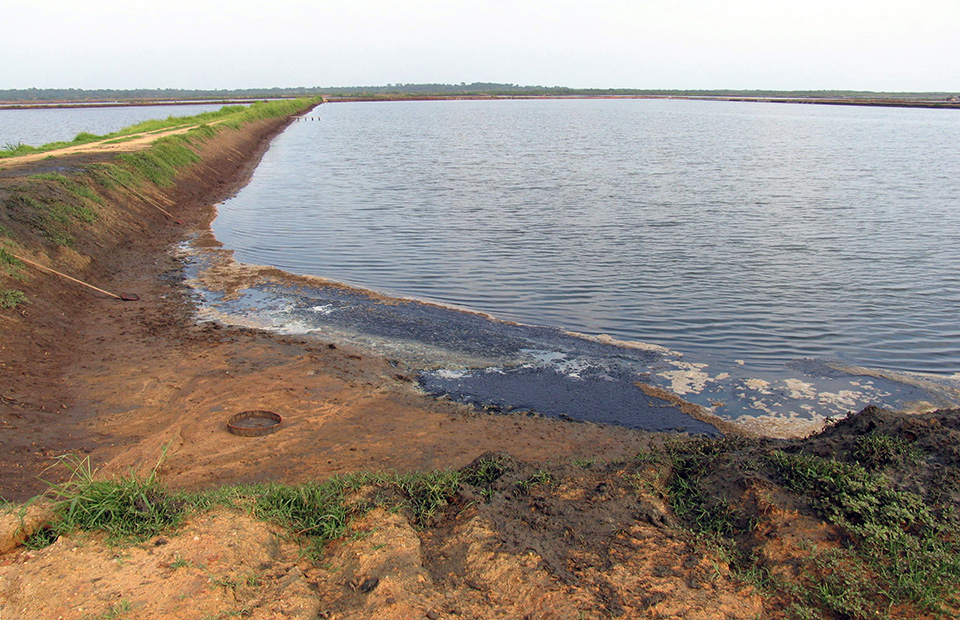
Besides, there is no sure method for reducing ammonia nitrogen short of using a high rate of water exchange to flush ammonia out of culture units or lowering feed inputs and hence production. The common practices of inoculation with nitrifying bacteria or application of zeolite may be of limited value, so probably the best approach to ammonia nitrogen management is to adopt conservative stocking and feeding rates that minimize NH3-N input and avoid excessive phytoplankton blooms that cause high pH.
Enough aeration should be applied to avoid low dissolved-oxygen levels and encourage oxidation of ammonia nitrogen to nitrate by nitrifying bacteria. Disturbance of surface water by aeration also encourages NH3 diffusion into the air. Pond bottoms should be dried out between crops, and acidic soil should be limed to encourage oxidation of organic matter between crops to lessen ammonia nitrogen release into the water during crops.
(Editor’s Note: This article was originally published in the November/December 2013 print edition of the Global Aquaculture Advocate.)
Now that you've reached the end of the article ...
… please consider supporting GSA’s mission to advance responsible seafood practices through education, advocacy and third-party assurances. The Advocate aims to document the evolution of responsible seafood practices and share the expansive knowledge of our vast network of contributors.
By becoming a Global Seafood Alliance member, you’re ensuring that all of the pre-competitive work we do through member benefits, resources and events can continue. Individual membership costs just $50 a year.
Not a GSA member? Join us.
Author
-

Department of Fisheries
and Allied Aquacultures
Auburn University
Auburn, Alabama 36849 USA
Related Posts
Health & Welfare
Nitrite toxicity affected by species susceptibility, environmental conditions
Nitrite, an intermediate compound in the oxidation of ammonia nitrogen to nitrate by nitrifying bacteria in soil and water, is considerably more toxic than nitrate. Exposure to nitrite causes gill lesions and edema in the skeletal muscles of fish, and also affects respiration.
Health & Welfare
Animal health giants have sea lice in their crosshairs
Alltech and Benchmark have been working on the next generation of sea lice solutions and believe they have new products that can help salmon farmers win.
Health & Welfare
A look at tilapia aquaculture in Ghana
Aquaculture in Ghana has overcome its historic fits and starts and is helping to narrow the gap between domestic seafood production and consumption. Production is based on Nile tilapia.
Responsibility
Factors affecting efficiency of commercial fertilizers in aquaculture
Intensification of pond aquaculture involves the use of commercial fertilizers such as urea and triple superphosphate to stimulate phytoplankton blooms. There is no objective way of determining the ideal fertilization rate for an individual pond.