Animal protein meals reduce feed costs but don’t improve shrimp performance
Most experimental diets led to a loss in shrimp weight at harvest
Brazil is among the largest global producers of beef, pork and poultry. In the slaughtering of these animals, a number of high-protein meals that can be used as ingredients in animal feeds are generated.
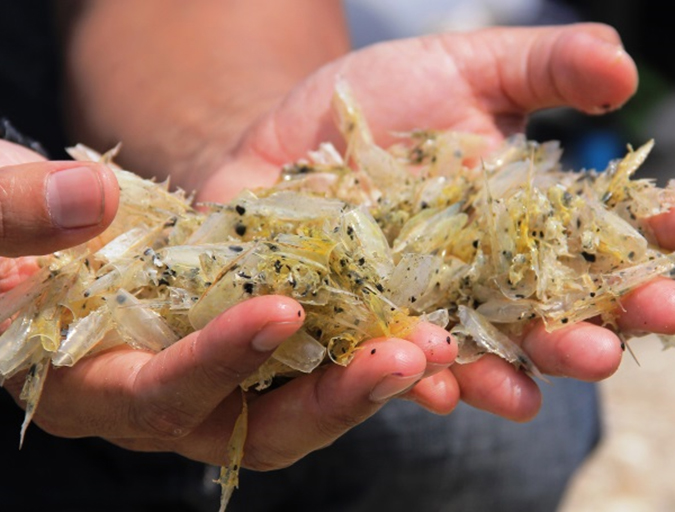
In aquatic feeds, various types of rendered animal byproducts are frequently incorporated to meet the nutritional requirements of farmed fish and shrimp. Among the most widely used animal ingredients are poultry by-product meal, feather meal, meat and bone meal, blood meal and fishmeal made from marine fish offal and fisheries bycatch.
Due to their year-around availability and attractive prices, these raw materials have been used in the composition of diets for the grow-out of white shrimp (Litopenaeus vannamei). However, it is unclear whether the use of these ingredients entails some expense to the growth performance of the species.
The authors conducted a study to establish if savings in formula costs translated into any loss in the growth performance of white shrimp fed diets containing animal byproduct meals produced in Brazil.

Study setup
The study was conducted at the aquaculture facilities of the Instituto de Ciências do Mar (LABOMAR) in northeastern Brazil. Initially, non-specific-pathogen-free shrimp were purchased as P.L.12 and stocked at 2 postlarvae/L in 3,000-L nursery tanks until they reached about 1 gram in body weight.
Shrimp were then transferred to round 23-cubic-meter tanks at 250 animals per square meter. At 2.03 ± 0.21 grams mean body weight, 2,000 juvenile shrimp were transferred to 50 indoor 500-L tanks operated under continuous water recirculation and filtering. Forty shrimp were stocked in each tank and raised for 74 days.
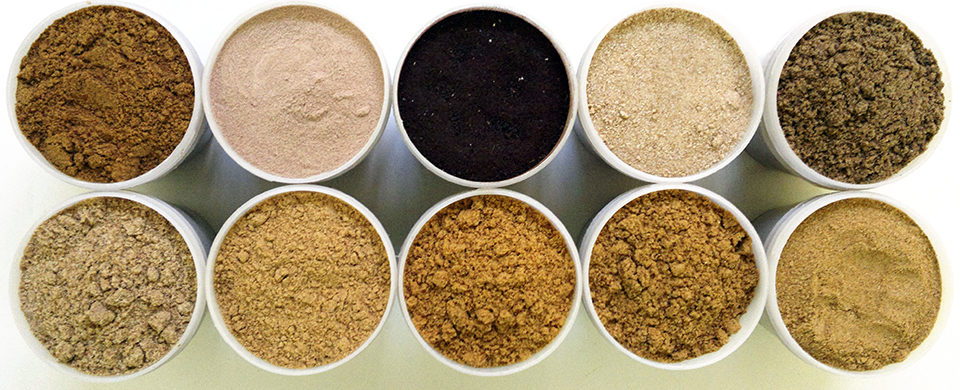
Ten protein ingredients of animal origin were evaluated in the study. Ingredients were purchased locally from known manufacturers or distributors. All ingredients were manufactured in Brazil, with the exception of salmon meal imported from Chile and used as a control. Prior to formulation, the ingredients were sent for chemical analysis to a specialized laboratory (Table 1).
Nunes, Proximate composition, Table 1
| Composition | Salmon Meal | Swine Plasma Meal | Blood Meal | Meat and Bone Meal 1 | Feather Meal | Meat and Bone Meal 2 | Tilapia Meal | Poultry By-Product Meal With Feather Meal | Poultry By-Product Meal | Local Fishmeal |
|---|---|---|---|---|---|---|---|---|---|---|
| Moisture (%) | 7.7 | 8.4 | 7.0 | 6.0 | 8.3 | 5.0 | 6.3 | 7.4 | 6.2 | 7.4 |
| Crude protein (%) | 66.1 | 78.5 | 87.2 | 41.1 | 75.6 | 47.6 | 62.8 | 62.4 | 58.5 | 50.3 |
| Total fat (%) | 10.0 | 0.1 | 0.4 | 10.1 | 6.9 | 11.9 | 6.9 | 13.6 | 17.2 | 7.8 |
| Fiber (%) | 0.1 | 0 | 0.1 | 0.6 | 5.6 | 1.3 | 0.1 | 0.3 | 0.4 | 0.5 |
| Ash (%) | 15.4 | 8.2 | 5.4 | 41.8 | 34.7 | 23.1 | 14.4 | 15.4 | 32.2 | |
| Phosphorous (%) | 2.3 | 0.3 | 0.2 | 6.5 | 0.3 | 5.3 | 4.0 | 2.5 | 2.7 | 5.0 |
| Calcium (%) | 3.6 | 0.1 | 0.6 | 15.7 | 1.5 | 11.6 | 8.5 | 4.7 | 4.9 | 11.1 |
| Digestibility (pepsin at 0.0002%) | 76.6 | 99.1 | 61.7 | 45.5 | 11.1 | 54.6 | 79.0 | 42.5 | 59.3 | 51.7 |
| Peroxide (meq O2/kg) | 5.1 | 0 | 10.9 | 3.1 | 12.2 | 5.6 | 2.2 | 65.6 | 3.1 | 10.4 |
| Market price (U.S. $/mt) | 1,439 | 5,000 | 777 | 460 | 432 | 576 | 1,093 | 806 | 806 | 1,036 |
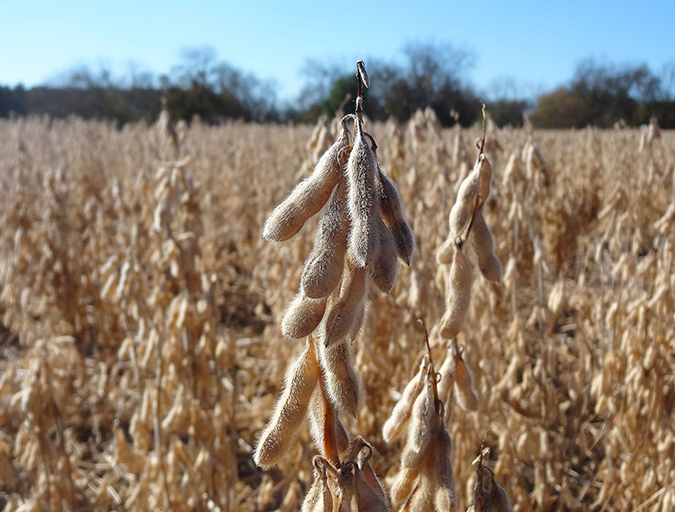
All diets contained 45.0 percent soybean meal, 30.0 percent wheat flour, 2.0 percent fish oil, 2.0 percent soybean lecithin, 1.0 percent vitamin-mineral premix, 0.5 percent synthetic binder and 0.03 percent potassium chloride.
The control diet had a maximum inclusion of 14.4 percent salmon meal (Table 2). In the other diets, salmon meal was partially or completely replaced by the tested ingredients using the maximum allowed inclusion. No attempt was made to balance diets for micronutrients such as essential amino acids, fatty acids and minerals. Only crude protein and total fat were adjusted in the experimental diets.
Nunes, Composition and formulated chemical profiles, Table 2
| Composition | Salmon Meal | Swine Plasma Meal | Blood Meal | Meat and Bone Meal 1 | Feather Meal | Meat and Bone Meal 2 | Tilapia Meal | Poultry By–Product Meal With Feather Meal | Poultry By–Product Meal | Local Fishmeal |
|---|---|---|---|---|---|---|---|---|---|---|
| Salmon meal | 14.37 | – | 8.80 | 6.32 | 3.98 | 1.75 | – | – | – | – |
| Swine plasma meal | – | – | – | – | – | – | – | – | – | – |
| Blood meal | – | 16.24 | 7.00 | – | – | – | – | – | – | – |
| Meat and bone meal 1 | – | – | – | 12.95 | – | – | – | – | – | – |
| Feather meal | – | – | – | – | 14.39 | – | – | – | – | – |
| Meat and bone meal 2 | – | – | – | – | – | 17.72 | – | – | – | – |
| Tilapia meal | – | – | – | – | – | – | 15.12 | – | – | – |
| Poultry by–product meal with feather meal | – | – | – | – | – | – | – | 15.27 | – | – |
| Poultry by–product meal | – | – | – | – | – | – | – | – | 16.24 | – |
| Local fishmeal | – | – | – | – | – | – | – | – | – | 18.67 |
| Kaolim | 4.40 | 3.23 | 2.47 | – | 0.40 | – | 3.25 | 4.20 | 3.23 | 0.10 |
| Soybean oil | 0.70 | – | 1.20 | 0.20 | 0.70 | – | 1.10 | – | – | 0.70 |
| Others* | 80.53 | 80.53 | 80.53 | 80.53 | 80.53 | 80.53 | 80.53 | 80.53 | 80.53 | 80.53 |
| Formula cost (U.S. $/mt) | 671.5 | 585.1 | 649.3 | 602.7 | 578.4 | 576.7 | 633.5 | 578.6 | 585.1 | 652.0 |
| Estimated Proximate Composition (%) | ||||||||||
| Crude protein | 35.00 | 37.40 | 37.40 | 35.00 | 39.00 | 35.00 | 35.00 | 35.00 | 35.00 | 35.00 |
| Total fat | 7.00 | 7.00 | 7.00 | 7.00 | 7.00 | 7.20 | 7.00 | 7.00 | 8.70 | 7.00 |
| Methionine | 0.64 | 0.62 | 0.61 | 0.56 | 0.53 | 0.52 | 0.64 | 0.55 | 0.56 | 0.64 |
| Methionine and cycstine | 1.16 | 1.17 | 1.17 | 1.07 | 1.44 | 1.03 | 1.16 | 1.13 | 1.14 | 1.15 |
| Lysine | 2.18 | 2.45 | 2.46 | 2.04 | 1.96 | 1.96 | 2.19 | 2.00 | 2.01 | 2.18 |
| Calcium | 0.66 | 0.50 | 0.50 | 2.40 | 0.50 | 2.30 | 1.43 | 0.85 | 0.94 | 2.21 |
| Phosphorus | 0.62 | 0.54 | 0.50 | 1.30 | 0.43 | 1.30 | 0.90 | 0.67 | 0.73 | 1.23 |
Table 2. Composition and formulated chemical profiles of diets.
The shrimp diets were prepared using a laboratory extruder equipped with a 1.8-mm die. Shrimp were fed twice daily to excess using feeding trays. Five tanks were designated for each diet type.
Results
There was little variation in water quality throughout the experimental period – 29 ± 2.8 ppt salinity, 7.9 ± 0.25 pH and 26.9 ± 0.30 degrees-C temperature. At shrimp harvest, there were statistically significant differences for all shrimp performance parameters (P < 0.05, Table 3).
Nunes, Mean performance of white shrimp, Table 3
| Diet | Survival (%) | Yield (g/m2) | Growth (g/week) | Feed Intake (g/shrimp) | Feed-Conversion Ratio |
|---|---|---|---|---|---|
| Salmon meal | 90.0 ± 2.6ab | 555 ± 59a | 0.87 ± 0.07ce | 13.50 ± 0.92ac | 1.74 ± 0.08a |
| Swine plasma meal | 86.5 ± 3.9ab | 480 ± 57a | 0.79 ± 0.05acd | 11.50 ± 0.92ac | 1.71 ± 0.07a |
| Blood meal | 92.0 ± 2.7ab | 535 ± 32a | 0.82 ± 0.03ac | 13.40 ± 0.78ac | 1.76 ± 0.02a |
| Meat and bone meal 1 | 98.0 ± 0.5b | 567 ± 20a | 0.81 ± 0.03ac | 14.60 ± 0.32b | 1.82 ± 0.04a |
| Feather meal | 94.0 ± 1.7b | 515 ± 22a | 0.77 ± 0.04acd | 13.30 ± 0.39ac | 1.81 ± 0.03a |
| Meat and bone meal 2 | 93.0 ± 1.2cb | 442 ± 20ab | 0.67 ± 0.04ab | 11.00 ± 0.59ab | 1.74 ± 0.03a |
| Tilapia meal | 92.0 ± 1.5ab | 391 ± 34ab | 0.60 ± 0.05bd | 10.50 ± 0.76ab | 1.91 ± 0.06ab |
| Poultry by-product meal with feather meal | 79.5 ± 4.4a | 288 ± 30b | 0.55 ± 0.02b | 8.90 ± 0.42b | 2.24 ± 0.18b |
| Poultry by-product meal | 88.5 ± 3.1ab | 487 ± 43a | 0.78 ± 0.04ae | 12.40 ± 0.83ac | 1.79 ± 0.04a |
| Local fishmeal | 89.0 ± 2.3ab | 444 ± 30a | 0.71 ± 0.02abc | 10.80 ± 0.52ab | 1.72 ± 0.04a |
Final shrimp survival was higher than 90 percent for shrimp fed all diets except those including swine plasma meal, poultry byproduct meal with feather meal, poultry byproduct meal and fishmeal. Higher shrimp yields were observed for diet treatments with partial substitution of salmon meal with meat and bone meal, blood meal and father meal. Although the yield for shrimp fed diets with complete replacement of salmon meal was not statistically different (P < 0.05), they all achieved values below 500 grams per square meter. Shrimp fed feather meal achieved the lowest yield.
Weekly shrimp growth also varied statistically according to diet type. Growth in excess of 0.80 grams was only achieved with diets with partial substitution of salmon meal, except in the case of blood meal substitution. Shrimp fed poultry byproduct meal with feather meal grew only 0.55 grams per week. Comparatively, the diets containing meat and bone meal promoted weekly growth of 0.81 and 0.67 grams.
Feeding diets with tilapia meal or local fishmeal saw weekly growth of 0.60 and 0.71 grams, respectively – lower values than the 0.87 grams achieved with the control diet. These differences, however, were not statistically significant (P > 0.05).
Apparently, shrimp feed intake was not negatively influenced by the animal ingredients used, except when the animals were fed poultry byproduct meal with feather meal. Feed conversion rose significantly when shrimp received diets with poultry byproduct meal with feather meal and tilapia meal, which suggested lower protein digestibility for these ingredients.
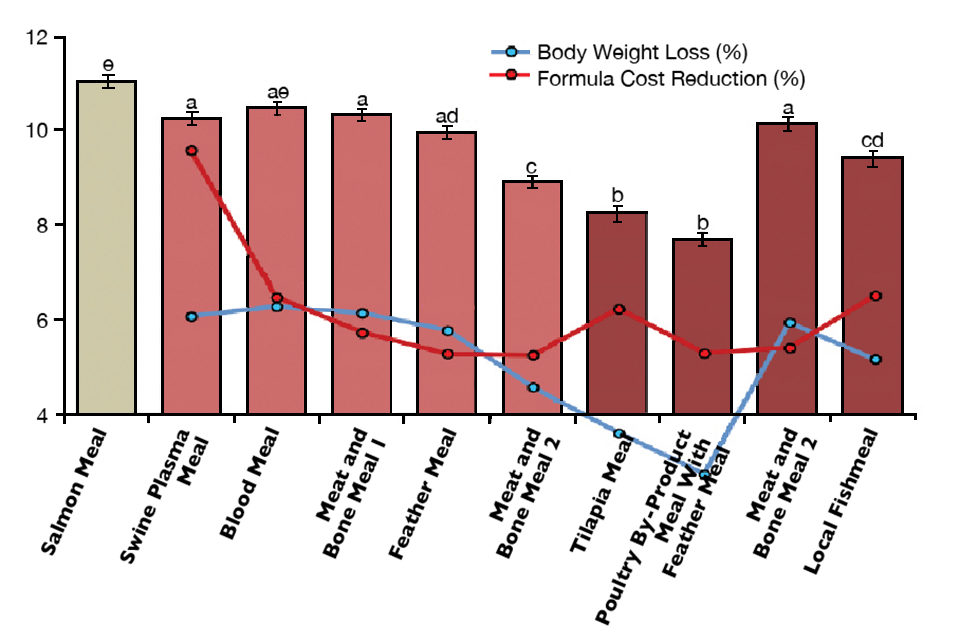
Most diets led to a loss in shrimp weight at harvest. An exception was the diet containing 7.0 percent blood meal in combination with 8.8 percent salmon meal (Fig. 1). However, the small 3.4 percent savings in formula cost is unlikely to justify the use of blood meal to partially replace salmon meal. The most significant decreases in shrimp body weight (over 20 percent) were found for diets with total replacement of salmon meal. The only exception was for poultry byproduct meal, which saw a 14.8 percent loss in final shrimp body weight compared to that for the salmon meal control diet.
(Editor’s Note: This article was originally published in the March/April 2012 print edition of the Global Aquaculture Advocate.)
Now that you've reached the end of the article ...
… please consider supporting GSA’s mission to advance responsible seafood practices through education, advocacy and third-party assurances. The Advocate aims to document the evolution of responsible seafood practices and share the expansive knowledge of our vast network of contributors.
By becoming a Global Seafood Alliance member, you’re ensuring that all of the pre-competitive work we do through member benefits, resources and events can continue. Individual membership costs just $50 a year.
Not a GSA member? Join us.
Authors
-

Instituto de Ciências do Mar
Universidade Federal do Ceará
Avenida da Abolição, 3207 – Meireles
Fortaleza, Ceará 60.165-081 Brazil -
Instituto de Ciências do Mar
Universidade Federal do Ceará
Avenida da Abolição, 3207 – Meireles
Fortaleza, Ceará 60.165-081 Brazil -
Nutrire Consultoria
Empresarial Ltda.
Campinas, São Paulo, Brazil
Related Posts
Health & Welfare
A holistic management approach to EMS
Early Mortality Syndrome has devastated farmed shrimp in Asia and Latin America. With better understanding of the pathogen and the development and improvement of novel strategies, shrimp farmers are now able to better manage the disease.
Aquafeeds
A look at phospholipids in aquafeeds
Phospholipids are the major constituents of cell membranes and are vital to the normal function of every cell and organ. The inclusion of phospholipids in aquafeeds ensures increased growth, better survival and stress resistance, and prevention of skeletal deformities of larval and juvenile stages of fish and shellfish species.

Aquafeeds
A look at protease enzymes in crustacean nutrition
Food digestion involves digestive enzymes to break down polymeric macromolecules and facilitate nutrient absorption. Enzyme supplementation in aquafeeds is a major alternative to improve feed quality and nutrient digestibility, gut health, compensate digestive enzymes when needed, and may also improve immune responses.
Health & Welfare
A look at tilapia aquaculture in Ghana
Aquaculture in Ghana has overcome its historic fits and starts and is helping to narrow the gap between domestic seafood production and consumption. Production is based on Nile tilapia.