Aquaculture feed composition helps define potential for water pollution
Uneaten feed, feces and metabolic wastes can adversely impact water quality
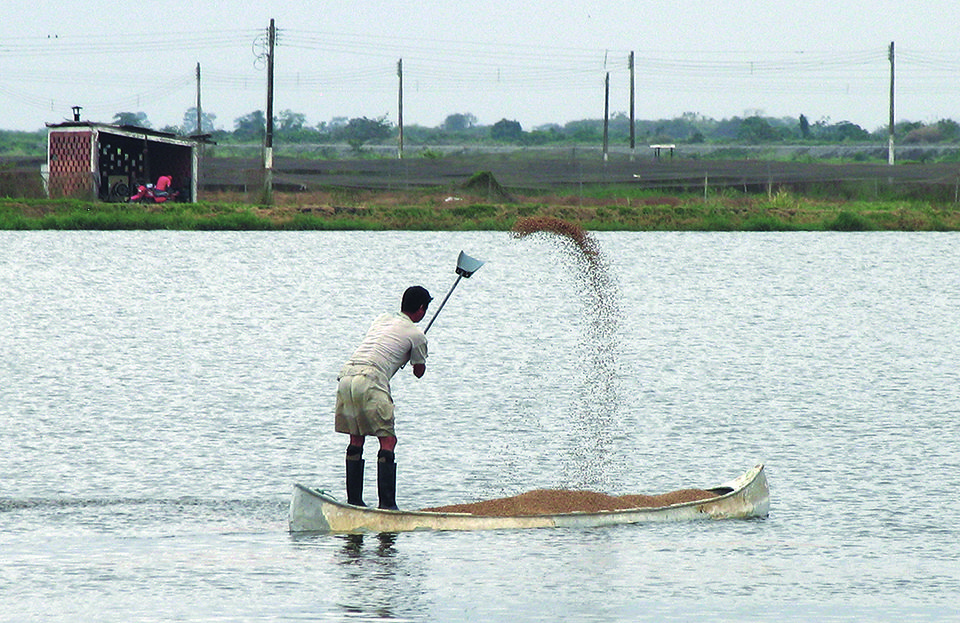
The most effective way of reducing the water pollution potential of feed is by using high-quality feed applied in a manner that assures culture animals fully consume it.
Intensive aquaculture relies on manufactured feeds to promote animal growth. Through the addition of supplementary feeds, production can be increased many times more than by fertilization alone. However, with an increase in feed use without proper management in aquaculture, there is a corresponding increase in the potential for water pollution caused by organic matter and nutrients originating in feed.
In commercial feed-based production, only a portion of the applied feed – usually 70 to 95 percent – is eaten by the culture species. The uneaten feed, feces and metabolic wastes enter the water and can adversely impact water quality. Manufactured feeds can lose nutrients by leaching immediately after immersion in water. Hence, some nutrient loss occurs even before the feed is eaten. It has been estimated that 60 to 80 percent of the nitrogen and phosphorus in feeds passes into the water column.
Nutrients from feeding waste can lead to a number of problems, including dense phytoplankton blooms, low dissolved-oxygen concentrations and increased concentrations of ammonia and other nitrogenous substances. Impaired water quality stresses fish and shrimp, potentially affecting their appetites and predisposing them to parasites and diseases.

The nitrogen content of feed can be estimated from information reported on feed bags, but manufacturers do not normally provide the concentrations of carbon, phosphorus and other elements of interest in water pollution assessments. Hence, a study was recently initiated at Auburn University to obtain detailed data on the chemical composition of feeds from several countries and for a variety of aquaculture species.
Information needed
Currently, the greatest need related to aquaculture and water pollution issues is more information on the concentrations of organic carbon, nitrogen and phosphorus in feeds. The concentrations of these compounds in feeds and whole bodies of culture animals are provided in Table 1 for five aquaculture species. Typical feed-conversion ratios for the animals are also included in the table.
Chatvijitkul, Feed Conversion Ratios, Table 1
| Species | Typical FCR | Feed (% air dry weight) Feed BOD (kg/kg feed): Carbon | Feed (% air dry weight) Feed BOD (kg/kg feed): Nitrogen | Feed (% air dry weight) Feed BOD (kg/kg feed): Phosphorus | Feed BOD (kg/kg feed) | Culture Species (% live weight): Carbon | Culture Species (% live weight): Nitrogen | Culture Species (% live weight): Phosphorus |
|---|---|---|---|---|---|---|---|---|
| Ictalurid catfish | 2.0 | 39.73 | 5.59 | 1.32 | 1.11 | 12.75 | 2.38 | 0.68 |
| Salmon | 1.1 | 45.60 | 8.07 | 1.50 | 1.05 | 16.80 | 2.96 | 0.40 |
| Trout | 1.2 | 43.40 | 8.12 | 1.56 | 1.09 | 15.60 | 2.50 | 0.35 |
| Shrimp | 1.5 | 39.44 | 7.54 | 1.54 | 1.16 | 11.00 | 2.86 | 0.32 |
| Tilapia | 1.7 | 39.23 | 5.95 | 1.28 | 1.08 | 11.70 | 2.22 | 0.72 |
Feed for salmon and trout had higher organic carbon concentrations than did catfish, shrimp and tilapia feeds. Nitrogen concentrations, as well as phosphorus concentrations, were similar among salmon, trout and shrimp feeds, and higher in these types than in catfish and tilapia feeds.
Whole body concentrations of organic carbon were greater in salmon and trout than in the other three species. Salmon and shrimp had the highest whole body nitrogen concentrations. Phosphorus concentrations were considerably greater in catfish and tilapia than in the other species.
Results from the study indicated that the crude protein concentrations reported for the feed by manufacturers were similar to the protein values estimated from the nitrogen content of feeds measured in the study.
Oxygen demand
The organic carbon and nitrogen in feeds that are not converted to the biomass of the culture species exert an oxygen demand. Part of the oxygen demand results from oxidation of organic carbon by the culture species and of organic wastes (feces and uneaten feed) by bacteria. The remainder of the oxygen demand is caused by nitrification.
Ammonia nitrogen from metabolism by the culture species and microorganisms of decay release ammonia that is oxidized to nitrate by nitrifying bacteria. The feed oxygen demand can be calculated as follows:
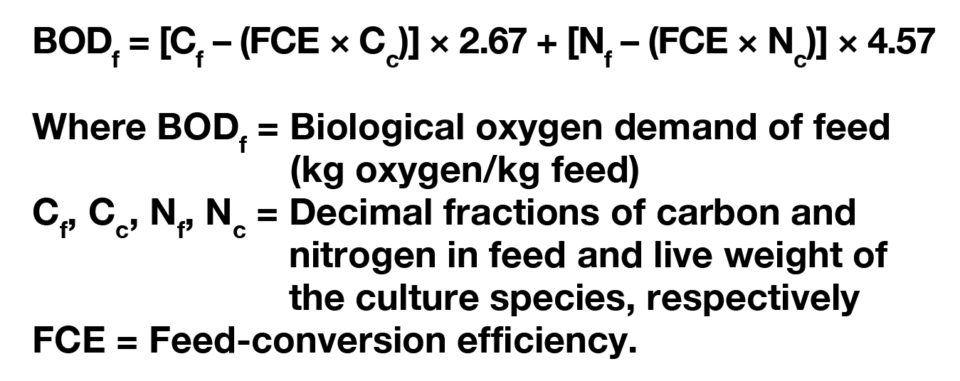
BOD calculations
The biological oxygen demand (BOD) values were calculated for feeds for each of the five species (Table 2). The values ranged from 1.05 kg oxygen/kg feed for salmon to 1.16 kg oxygen/kg feed for shrimp. The average for the five species was 1.10 kg oxygen/kg feed.
The total oxygen demand per kilogram of production can be estimated by multiplying the feed BODs by the feed-conversion ratio (FCR). The total oxygen demand for production of the five species ranged from 1.16 kg oxygen/kg for salmon to 2.22 kg oxygen/kg for channel catfish (Table 2).
Table 2. Biochemical oxygen demands (BODs) and loads of nitrogen and phosphorus associated with feed used to produce 1 kg of five common aquaculture species.
Chatvijitkul, BODs, Table 2
| Species | BOD (kg oxygen/ harvest kg) | Nutrient Load (g/harvest kg) Nitrogen | Nutrient Load (g/harvest kg) Phosphorus |
|---|---|---|---|
| Ictalurid catfish | 2.22 | 88.0 | 19.6 |
| Salmon | 1.16 | 59.2 | 12.5 |
| Trout | 1.31 | 72.4 | 15.2 |
| Shrimp | 1.69 | 84.5 | 19.9 |
| Tilapia | 1.84 | 79.0 | 14.6 |
The quantities of nitrogen and phosphorus entering culture systems can be estimated by subtracting the amounts of each element removed in the harvesting of 1 kg of the culture species from the quantity of each element applied in feed necessary to produce 1 kg of biomass. The equation for this calculation is illustrated below using nitrogen:
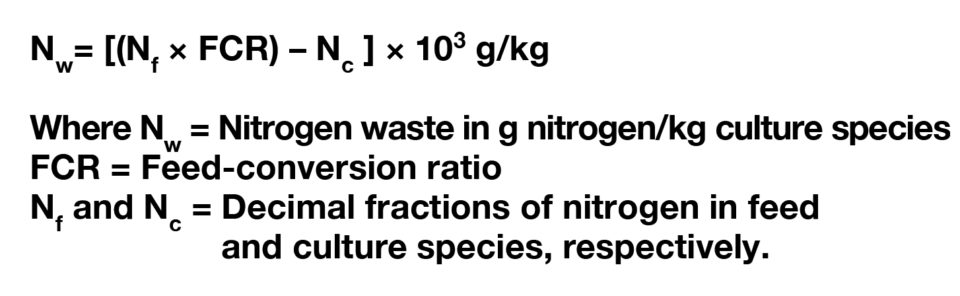
Waste loads for nitrogen ranged from 72.4 g/kg for trout to 88.0 g/kg for ictalurid catfish, with an average value of 76.6 g/kg. For phosphorus, values ranged from 12.5 g/kg for salmon to 19.9 g/kg for shrimp, with an average 0f 16.4 g/kg. Estimated percentages of the two nutrients added in feed that would enter the waters of culture systems ranged from 66.7 percent (salmon) to 78.7 percent (ictalurid catfish) for nitrogen and from 86.1 percent (shrimp) to 67.3 percent (tilapia) for phosphorus. Averages were 73.2 percent for nitrogen and 76.9 percent for phosphorus.
In ponds, a large portion of the feed BOD and waste nitrogen and phosphorus are assimilated within the system and not discharged in effluent. In raceway culture, some of the wastes may be removed by sedimentation in the ends of raceway units and disposed of on land. In cage culture, the entire waste load enters the receiving waters directly.
Perspectives
The most effective way of reducing the water pollution potential of feed – both within culture systems and in the water bodies receiving aquaculture waste – is through attention to feeds and feeding practices. High-quality feeds that contain no more nitrogen and phosphorus than necessary should be used. Feed should be applied in a manner to assure that culture animals eat essentially all of it. Good water quality should be maintained in culture systems to avoid stress that adversely affects the appetite of the culture species.
Presently, the digestibility of feed ingredients and processing technology play significant roles in improving feed quality and making feed more friendly to the environment. The addition of highly digestible ingredients in feeds can increase absorption and retention, as well as reduce wastage by reducing nutrient excretion.
Extrusion technology contributes significant positive impacts to the aquatic feed industry. Extrusion pellets have high stability and are durable, which reduces leaching and results in less wastage of nutrients and environmental pollution.
(Editor’s Note: This article was originally published in the July/August 2015 print edition of the Global Aquaculture Advocate.)
Now that you've reached the end of the article ...
… please consider supporting GSA’s mission to advance responsible seafood practices through education, advocacy and third-party assurances. The Advocate aims to document the evolution of responsible seafood practices and share the expansive knowledge of our vast network of contributors.
By becoming a Global Seafood Alliance member, you’re ensuring that all of the pre-competitive work we do through member benefits, resources and events can continue. Individual membership costs just $50 a year.
Not a GSA member? Join us.
Authors
-

Sirirat Chatvijitkul
School of Fisheries, Aquaculture and Aquatic Sciences
Auburn University
Auburn, Alabama 36849-5419 USA -
School of Fisheries, Aquaculture and Aquatic Sciences
Auburn University -
School of Fisheries, Aquaculture and Aquatic Sciences
Auburn University
Related Posts
Aquafeeds
A look at phospholipids in aquafeeds
Phospholipids are the major constituents of cell membranes and are vital to the normal function of every cell and organ. The inclusion of phospholipids in aquafeeds ensures increased growth, better survival and stress resistance, and prevention of skeletal deformities of larval and juvenile stages of fish and shellfish species.
Aquafeeds
Crude protein and lipid from biofloc meals from an activated sludge system
A study compared the bioavailability of crude protein and lipid from biofloc meals generated with an activated sludge system using two water sources: wastewater from shrimp experimental culture (BFL-W) and, artificially, using clean seawater (BFL-C).
Intelligence
Facts about shrimp and cholesterol
Many people, including health-conscious consumers, are concerned about the cholesterol content of foods such as meat, eggs and dairy products. In the case of shrimp, the cholesterol story is different because a number of research studies have demonstrated that the high percentage of “good fats” in shrimp reduce the impact of cholesterol, and that a majority of people can eat shrimp as part of a balanced diet.
Aquafeeds
Biofloc consumption by Pacific white shrimp postlarvae
The stable isotopes technique with δ13C and δ15N can be used to determine the relevance of different food sources to shrimp feeding during the pre-nursery phase of Litopenaeus vannamei culture. During this trial, different types of commercial feed, microalgae, Artemia sp. nauplii and bioflocs were used as food sources.