Changes in European consumer perceptions of farmed salmon
In surveys conducted over last five years, salmon scores high on healthfulness, equals chicken on food safety
Since 2012, we have undertaken surveys of households in France, Germany and the UK on their perceptions and consumption patterns for salmon and meat from agriculture. After 2012, global salmon production has been more or less stable, mainly due to biological and regulatory bottlenecks on the supply side. The market has not represented a barrier to growth, as the significant rise in salmon prices provides evidence that demand for salmon has shifted in a positive direction since 2012.
Here, we examine the development in consumers’ perceptions of salmon during the same period.
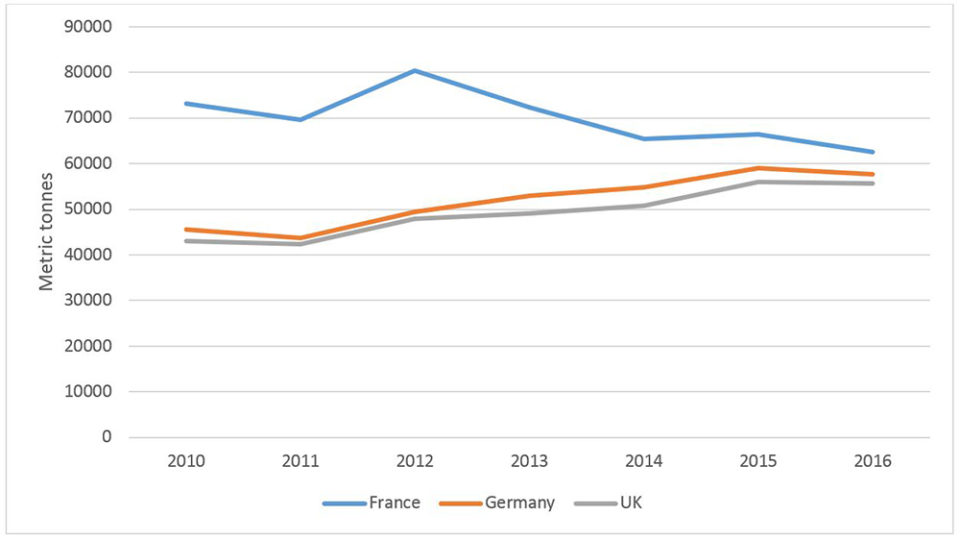
The countries that we focus on here have in sum also experienced a stagnant salmon market in volume terms from 2012 to 2017. Fig. 1 shows that retail sales of salmon in France declined from 80,000 metric tons (MT) in 2012 to 63,000 MT in 2016. During the same time period, German and UK salmon retail sales have increased from less than 50,000 MT to more than 55,000 MT.
Position in 2017
“Position” refers here to the consumer perception of a product relative to the perception of competing products. Consumer demand or willingness to pay for the product is to a large extent a function of its position. Here, we analyze the position of generic salmon against generic agricultural competitors – chicken, beef and pork – in France, Germany and the United Kingdom.
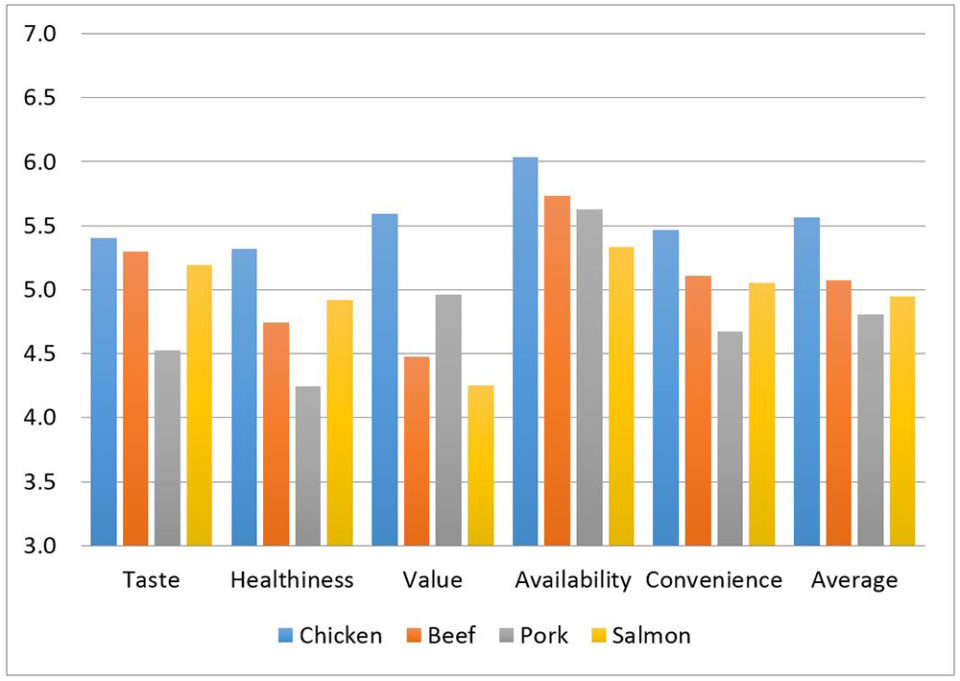
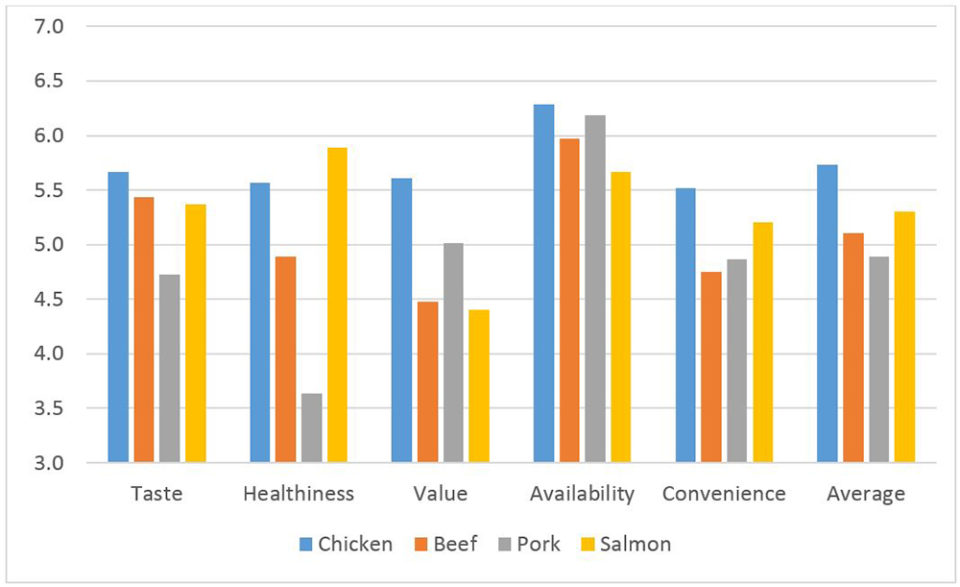
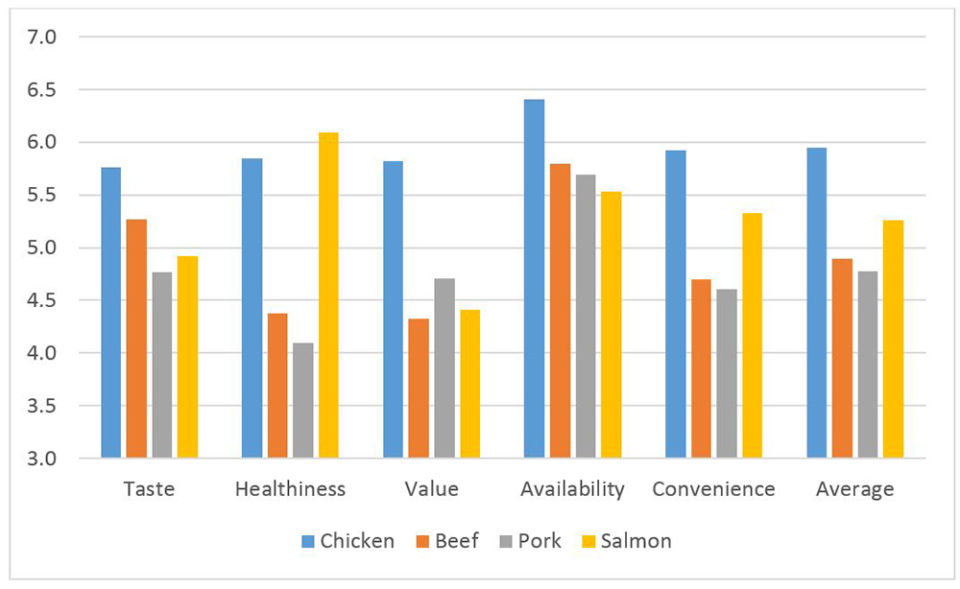
Figs. 2-4 show the perceptions of salmon and meat from agriculture in terms of taste, healthiness, availability, convenience and value for money. Consumers were asked to rate salmon, chicken, pork and beef on a scale from 1 (low) to 7 (high). The score for each dimension is the country average. For a product category (e.g. salmon) the average position is stronger the higher the value.
From Figs. 2-4, we see that salmon scores low on value for money. This may not be surprising given the high salmon prices consumers have faced in recent years. Healthfulness is the dimension where salmon has the strongest position compared to terrestrial meat – it is No. 1 in Germany and the UK, but ranks below chicken in France. In all other dimensions, chicken consistently beats salmon. Salmon tends to have a relatively stronger position compared to pork in several dimensions.
In all three countries, chicken has generally the strongest position when we take the average of all dimensions and assign them the same weight. The general position of salmon tends to be at the level of pork and beef. Salmon has a relatively stronger position in the UK and Germany than in France compared to beef and pork.
Change in position?
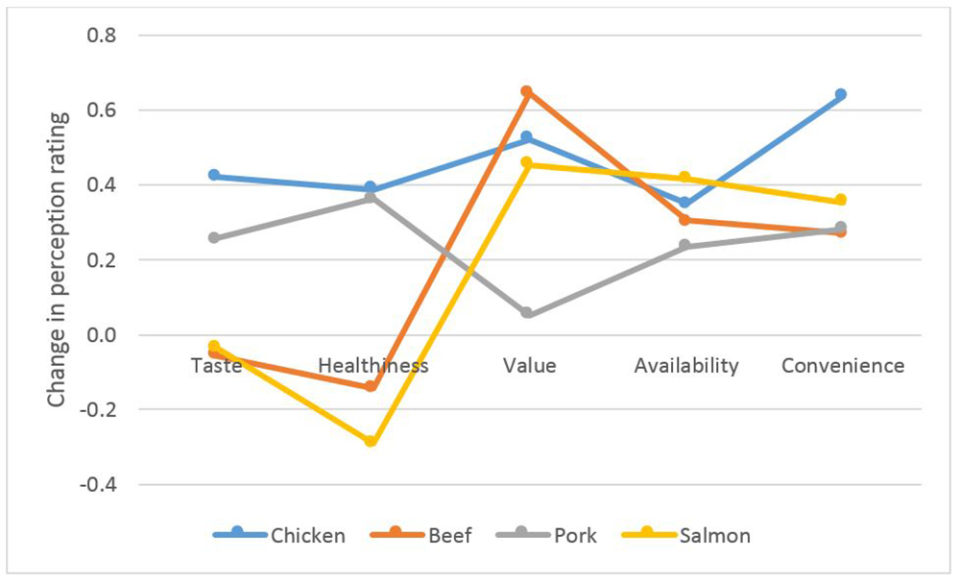
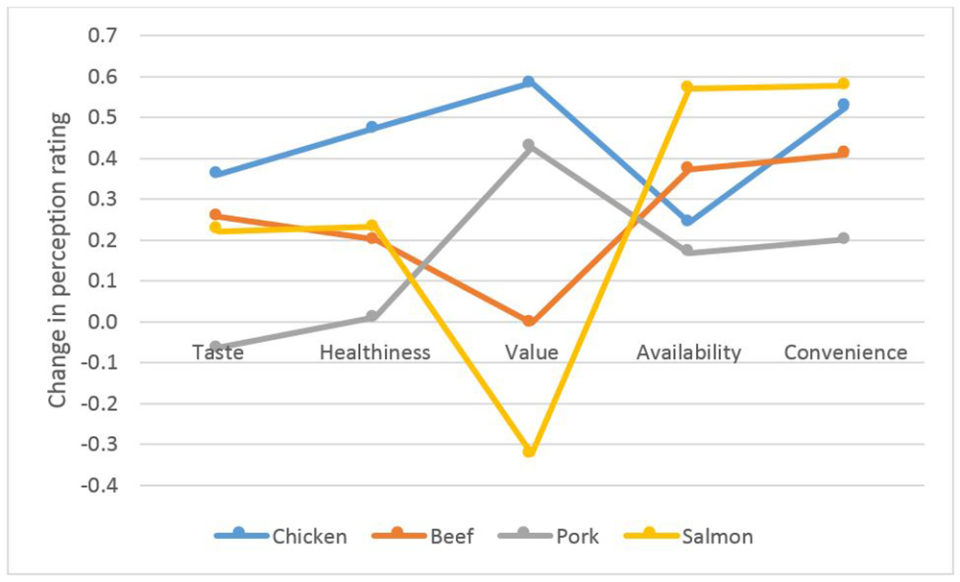
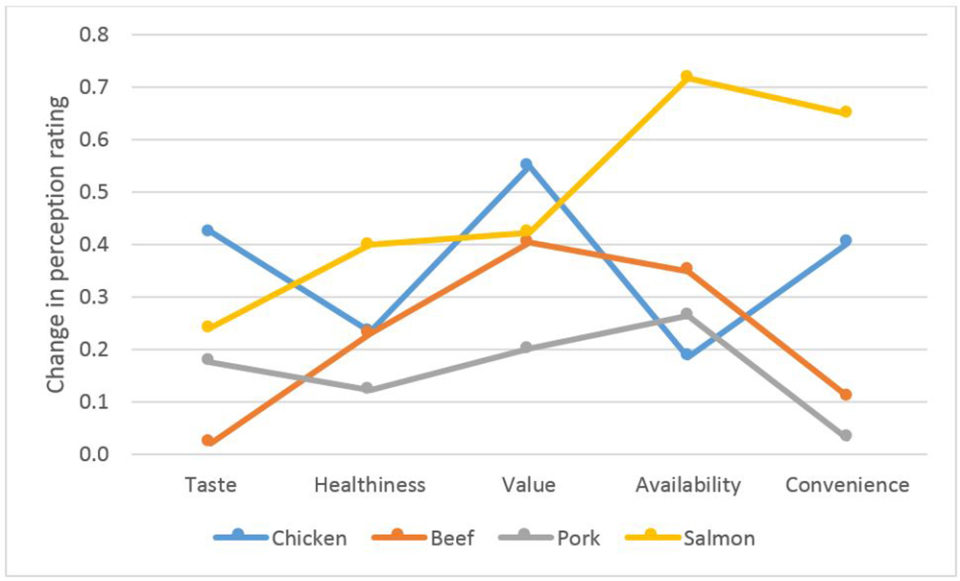
How has the position of these competing proteins changed over the five-year period from 2012 to 2017? In Figs. 5-7, we plot the change in the position in terms of taste, healthiness, value for money, availability and convenience. We are using the same rating scale as above, but now the vertical axis shows whether the rating increased from 2012 to 2017 (positive) or decreased (negative).
In these figures, a 0.5 increase would correspond to the rating of salmon increasing from, for example, 3.0 to 3.5. Furthermore, when the salmon point is above the other meats, then salmon has strengthened its position from 2012 to 2017, while if the salmon point is below, it has weakened its position compared to terrestrial meats.
A first general observation from Figs. 5-7 is that households in general rate the four proteins higher in 2017 than in 2012, since most of the points tend to be positive. Salmon seems to have made the strongest gains in availability and convenience from 2012 to 2017 in the three countries. This probably coincides with a development during the same time period where salmon has become increasingly available in different distribution channels to consumers, and the range of final consumer products based on salmon satisfying different convenience requirements have increased.
For healthfulness and value for money the development is much more mixed across the three countries. In Germany, the value for money rating has decreased for salmon, while it has increased in France and the UK. The perception of healthfulness has decreased in France for salmon, while in Germany and the UK it has increased during the same time period. Taste perceptions have been the most stable for salmon.
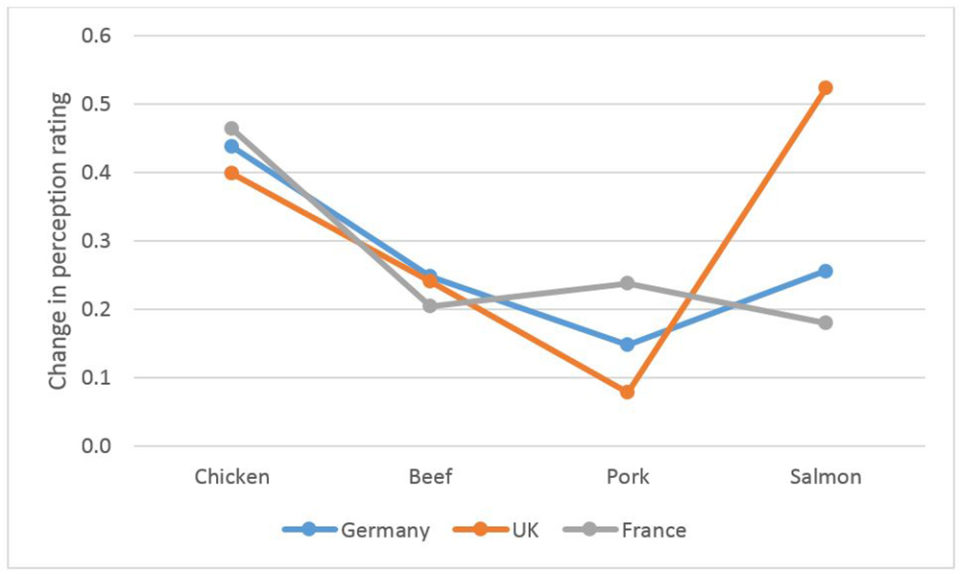
Overall changes in position
What can we say about the total change in consumers’ perceptions from 2012 to 2017? When we take a simple average of the five dimensions taste, healthfulness, value for money, availability and convenience for each country we get the picture shown in Fig. 8. We see that chicken improved its average rating more than beef and pork in all three countries. In Germany and France, chicken improved its position relative to salmon, but the UK saw the strongest gains for salmon.
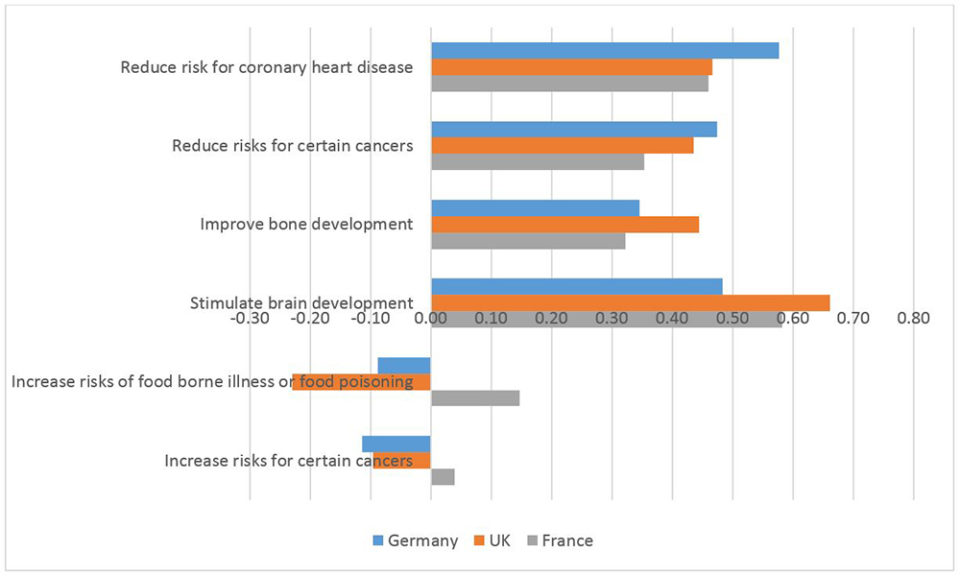
Health perceptions in 2017: salmon vs chicken
Examining what perceptions consumers have about the health effects of the regular consumption of salmon or chicken, consumers were presented different statements about the health effects of consumption and were asked if they agreed or disagreed on a 10-point scale.
Fig. 9 presents the difference between the average rating for salmon and chicken. In other words, we take the difference between the salmon rating and the chicken rating. If the difference is positive, consumers agree more strongly on the health-effect statements for salmon than for chicken, and vice versa for negative values. Fig. 9 tells us that salmon generally is perceived as having more healthful benefits than chicken on brain development, bone development, certain cancer risks and coronary heart disease risk. On food safety salmon and chicken is perceived as more equal.
The road ahead
During the last five years, salmon has established a strong position relative to pork in the minds of consumers in France, Germany and the UK. But salmon is still lagging behind chicken, and overall, we have not seen indications of convergence in the position of salmon and chicken over the last five years. When we examine consumers’ health perceptions, we find that salmon is perceived as a healthier product than chicken in all three countries.
The salmon market has experienced stagnant supply over the last five years due to biological and regulatory bottlenecks, and during the same period, prices have increased significantly. There are reasons to believe that the implied positive shifts in demand by these price increases are due to a mix of improved distribution and innovations in final consumer salmon products, e.g. tapping into growth in demand for sushi products. In these three countries, the relative increase in salmon’s convenience and availability positions provide support for this.
The road ahead for farmed salmon is partly dependent on its ability to solve bottlenecks on the production side. Problems with salmon parasites and diseases do not seem to spill over to consumers’ perceptions of salmon, and unless such problems become severe, it is fairly safe to assume that salmon will maintain a robust position in the minds of many consumers. Global income growth in combination with further innovations in distribution and final salmon products will probably be important factors ensuring high salmon prices ahead.
Acknowledgement: This research project, “Positioning study for salmon products” Project No. 900990, has been funded by the Norwegian Seafood Research Fund (FHF) and the Norwegian Seafood Council.
Now that you've reached the end of the article ...
… please consider supporting GSA’s mission to advance responsible seafood practices through education, advocacy and third-party assurances. The Advocate aims to document the evolution of responsible seafood practices and share the expansive knowledge of our vast network of contributors.
By becoming a Global Seafood Alliance member, you’re ensuring that all of the pre-competitive work we do through member benefits, resources and events can continue. Individual membership costs just $50 a year.
Not a GSA member? Join us.
Authors
-

The University of Stavanger
4036 Stavanger, Norway -

Bachelor student
The University of Stavanger
4036 Stavanger, Norway
-

The University of Stavanger
4036 Stavanger, Norway
-

Bachelor student
The University of Stavanger
4036 Stavanger, Norway
Related Posts
Intelligence
Consumer survey explores farmed, wild seafood perceptions
What do shoppers really think about farmed and wild seafood? Commissioned by The Fishin’ Co. and the Global Aquaculture Alliance, an extensive survey conducted earlier this year sought to determine the key drivers in consumers’ seafood purchasing habits and their perception of aquaculture.

Intelligence
Boston brainstorm: Getting consumers to embrace aquaculture
In a discussion format somewhat unique to the bustling halls of Seafood Expo North America, aquaculture backers lamented the lackluster U.S. consumer acceptance for farmed fish.
Intelligence
Doctors: Place a greater value on seafood consumption
Many important organizations around the world fail to acknowledge the importance of seafood to human health and well-being. There is a disconnect between what we know regarding the benefits of seafood and what is being done to acknowledge these benefits and increase seafood consumption in nutrition.
Intelligence
Love connection: Aquaculture investor finds partner in retail seafood brand
For the first time, the Aqua-Spark investment fund has partnered with a consumer brand. With its investment in U.S. company LoveTheWild, the Netherlands-based group seeks to become a trusted voice in aquaculture.