Climate change likely already affecting global food production
Impact resulted in about 1% reduction in food calories for 10 main crops

Assessing the impacts of recent climate change complements long-term forecasts and identifies which crops and places are already at greater risk. Since the 1970s, global surface temperature warmed at an average of 0.16 to 0.18 degrees-C per decade, a rate higher than any period since the industrial revolution. During that same period, we find that the growing season temperature, over all harvested areas for the top 10 global crops – barley, cassava, maize, rice, oil palm, rapeseed, sorghum, sugarcane, soybean and wheat – increased 0.5 to 1.2 degrees-C. Growing season precipitation changes were more variable; from a decrease of 3.4 mm averaged over all sugarcane harvested croplands to an increase of ~19 mm averaged over all oil palm harvested croplands.
This article – adapted and summarized from the original publication – reports on a study where linear regression relationships were constructed and analyzed using weather and reported crop data to assess the potential impact of observed climate change on the yields of the top 10 global crops.
Study setup
We studied the top 10 global crops from around the world where they are commonly harvested. Not all crops are harvested everywhere and each year. We constructed linear regression relationships using two datasets – climate and weather, and crop yields and harvested areas – to assess the potential impact of observed climate change on yields.
For detailed information on the study methods, databases, climate and crop data, mapping and data analyses, please refer to the original publication.

Results and discussion
Although recent changes in mean climate occurred across all croplands, the statistical relationship between weather and crop yields was significant in 54 to 88 percent of harvested areas globally across crops (p < 0.05; Fig. 1). There are differences in the spatial extent of the statistically significant harvested croplands among crops and regions. For example, in 88 percent (125 million hectares (Mha)) of rice-harvested croplands, the relationship was significant but only in 54 percent (22 Mha) of sorghum harvested areas globally. Within North and Central America recent climate change impact was consequently significant over 89 percent of maize but 71 percent of wheat-harvested areas.
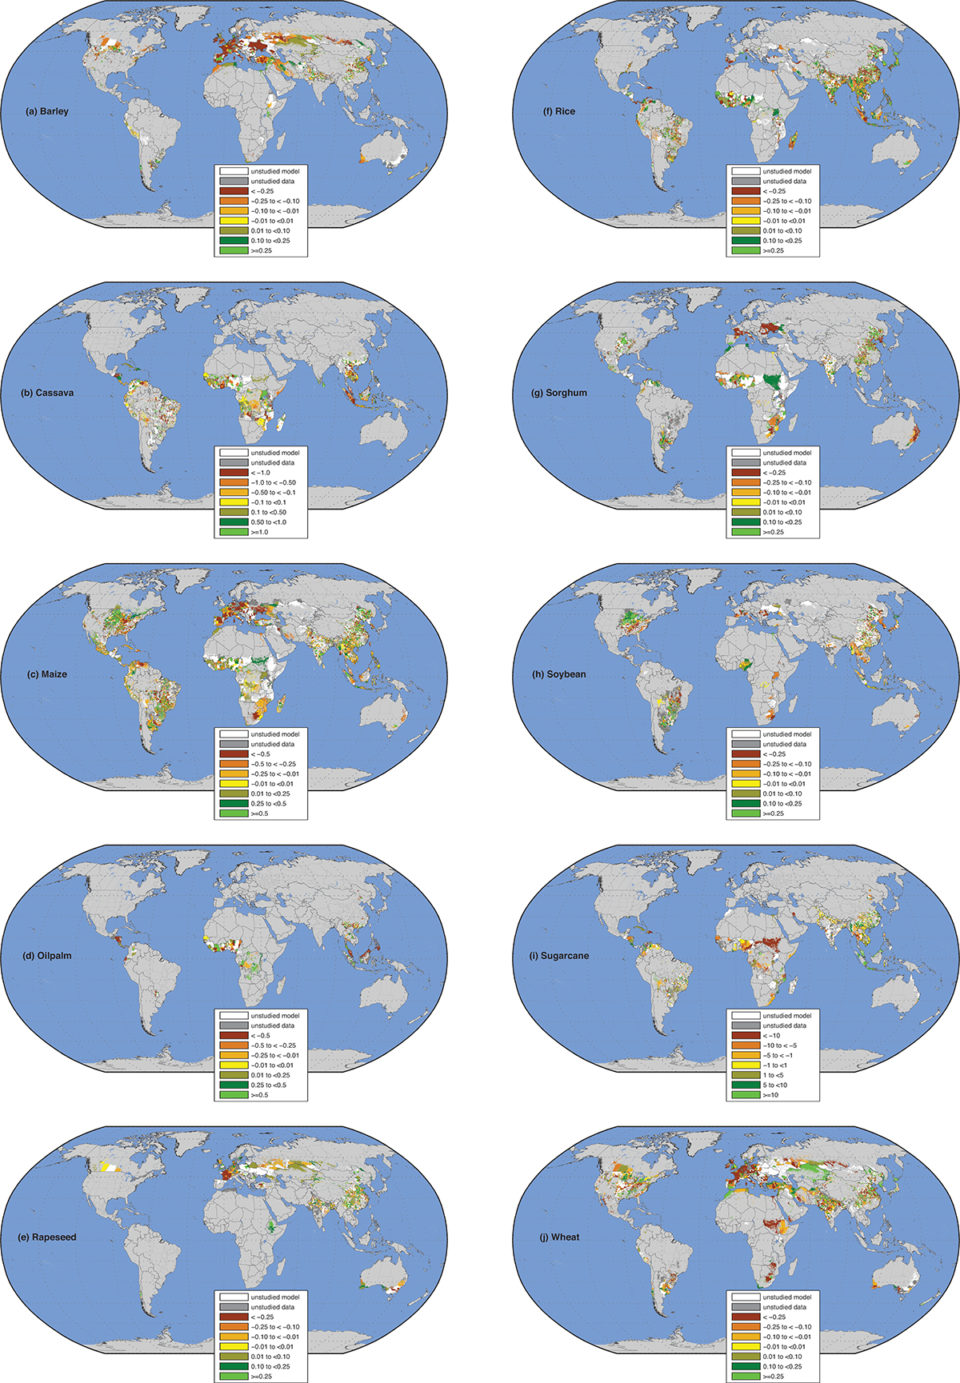
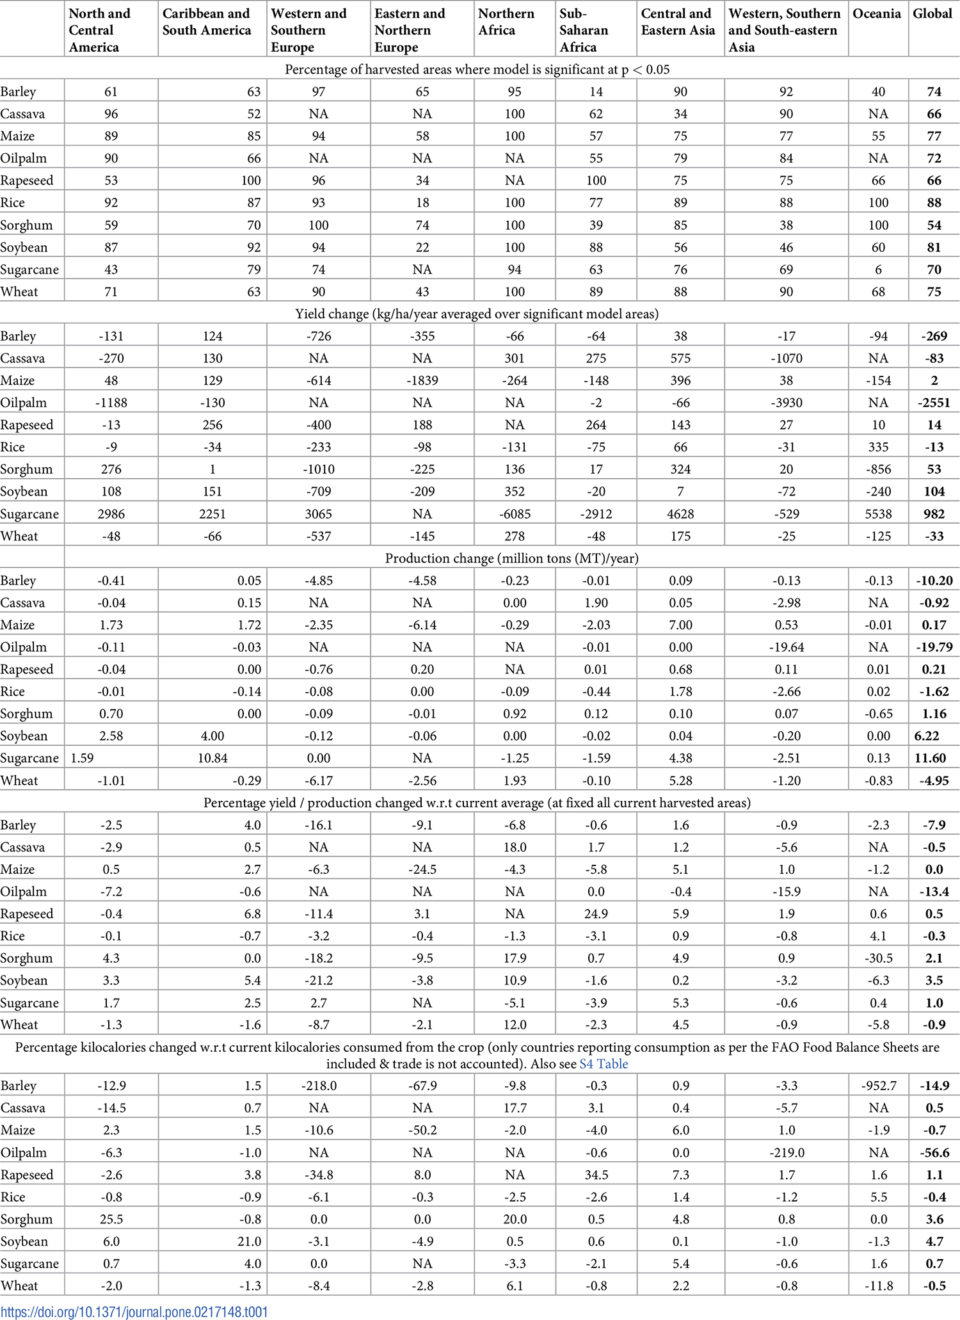
Averaged globally, yields changed between minus-2551 (oil palm) to plus-982 (sugarcane) kg/ha/year (Table 1). The percentage change in recent yield over all harvested croplands ranged from minus-13.4 percent (oil palm) to plus-3.5 percent (soybean). Among the top three global cereals, recent yields have decreased for rice (minus-0.3 percent or ~-1.6 million tons, or MT, annually) and wheat (minus-0.9 percent or ~ minus-5.0 MT annually) and increased negligibly for maize (0 percent or ~0.2 MT annually). This translates to an annual 0.4 percent, 0.5 percent and 0.7 percent decrease in consumable food calories available from rice, wheat and maize respectively globally. Recent climate change generally decreased yields across Europe, Sub-Saharan Africa and Australia, increased yields in Latin America, and had mixed responses in North and Central America and in Asia.
Table 1. Impact of mean climate change summarized by large regions.
Specifically when assessing the impact of recent climate change on crop production in countries where hunger is prevalent, we found the following: across the 53 countries with a hunger index of serious, alarming, or seriously alarming in 2008, we find that recent climate change had decreased consumable calories in 27 countries and increased in 26. Losses in consumable calories compared to total consumed food calories annually were particularly great in southern parts of the African continent, such as in Zimbabwe (minus-7.2 percent), Malawi (minus-6.5 percent) and Mozambique (-2.8 percent); in western Africa such as in Mali (minus-3.9 percent) and Ghana (minus-3.8 percent); and in Asia such as in India (minus-0.8 percent) and Nepal (minus-2.2 percent).
Globally, the average annual change is large for those consuming these ten crops (~minus-1 percent) but not negligible across all consumable food calories as well (~minus-0.5 percent). Although this metric does not address food access, nutrition, and other components of food security, it suggests that climate change has increased the risk of food insecurity in many food insecure countries.
Our study directly addressed the connection of climate change impact to food security impact by translating the potential impact of recent climate change on crop yields to consumable food calories change in each country. While translating crop production change to consumable food caloric change, we accounted for the current dietary consumption pattern of individual crops per country, including bookkeeping for directly and indirectly consumed calories in each country.
We found that out of the studied 53 countries with a hunger index of serious, alarming, or seriously alarming in 2008, 27 countries (or ~51 percent) had decreased consumable calories due to mean climate changes (~ minus-0.4 percent in these ten crops or ~ minus-0.3 percent across all food calories consumed across all 53 countries studied). Though we detected subnational level crop yield and production changes, determining consumable food caloric changes at that level would require data not available globally: subnational dietary patterns, evaluation of the climate change impact in the entire food supply chain and socio-economic conditions. These individual issues should be explored in future studies to understand mean climate change impacts on local scale food security.
Our study provides more detail on the spatial resolution and a larger number of crops than previously studied and is the first observational global study reporting the impact of current climate change on the yields of the top 10 global crops. Six of them – barley, cassava, oil palm, rapeseed, sorghum and sugarcane – are the next important global crops after maize, rice, wheat and soybean for daily dietary calories. Some such as cassava and sorghum are a major source of calories in food insecure regions (~3.5 percent and ~3.4 percent of total food calories provided respectively). Sugarcane, oil palm and rapeseed are important commodity crops with the latter two having greatly expanded in recent decades.
We find a range of impacts of mean climate change on crop yields and production in different regions. We found that crop yields across Europe, sub-Saharan Africa and Australia had in general decreased because of climate change, though exceptions are present. Similar variations are seen in other crops and regions all over the world. They are indicative of the underlying variations of agronomic growing conditions that range from the agro-meteorological to crop management. Precipitation variations for example are much heterogeneous in their trends and thus captured well using time series analysis per political unit compared to the more homogeneous patterns of temperature trends.
Our analysis focuses on historical precipitation and temperature change impacts on crop production and food security. Future studies should explore impacts from extreme temperature changes; for example, determining thresholds and exposure to killing degree days, extreme precipitation impacts both historically, as well as for the expected future warming and intensification of the hydrological cycle for larger number of crops as well as for livestock.
Various agronomic changes and advancements can also mask climate change adaptation measures: irrigation expansion can occur for stabilizing crop production, expansion into new areas, or for double cropping in the dry season; but they can also serve as a measure to counter the effects of extreme heat. Crop planting dates can advance in colder regions of the world as agronomic techniques advance, but also because climate is getting warmer on average.
These nuances should be explicitly modeled in future studies to tease out such individual contributions. Other related variables that could be considered in future global studies are radiation use efficiency changes, weed, pest and pathogen infestation changes, soil moisture variability on crop productivity and other important biophysical changes to determine their relative contributions to crop yields at the local to the global scale.
Changes in both current and future variability in climate and changes in future extreme events need further analysis as well as the changing strategy of farmers especially in globally traded commodity crops. Lastly, crop yields and production are not only impacted from climate change, but also drive climate change.
Perspectives
Our findings illustrate that climate change has potentially already affected global production of the ten largest land crops and the production of consumable food calories in specific countries and globally.
The approach we used in our study complements the long-range projections, avoids many of the challenges faced by process-based models, and analyzes a broader set of crops. Although recent climate change has likely reduced overall consumable food calories in these ten crops by ~1 percent (or ~0.5 percent across all food calories), there is much variability among crops and regions.
These findings can be used to target interventions for adaptation to climate change through better management, crop breeding, and switching crops as climate continues to evolve.
Now that you've reached the end of the article ...
… please consider supporting GSA’s mission to advance responsible seafood practices through education, advocacy and third-party assurances. The Advocate aims to document the evolution of responsible seafood practices and share the expansive knowledge of our vast network of contributors.
By becoming a Global Seafood Alliance member, you’re ensuring that all of the pre-competitive work we do through member benefits, resources and events can continue. Individual membership costs just $50 a year.
Not a GSA member? Join us.
Authors
-

Institute on the Environment (IonE)
University of Minnesota
Saint Paul, Minnesota, USA -
Institute on the Environment (IonE)
University of Minnesota
Saint Paul, Minnesota, USA -
Department of Natural Resources Science and Management
University of Minnesota
Saint Paul, Minnesota, USA.
Now at the Oxford Martin School and Nuffield Department of Population Health
University of Oxford
Oxford, United Kingdom -
Institute on the Environment (IonE)
University of Minnesota
Saint Paul, Minnesota, USA -
Department of Geosciences and Natural Resource Management (IGN)
University of Copenhagen
Copenhagen, Denmark -
School of Statistics
University of Minnesota
Minneapolis, Minnesota, USA
Related Posts

Intelligence
A motive, and a market, for farmed fish in Mexico
Boasting ample areas for aquaculture and a robust domestic demand for seafood – not to mention its close proximity to the U.S. market – a land of opportunity lies in Mexico. Fish farming is primed to meet its potential south of the border.

Innovation & Investment
Aquaculture Exchange: Flavio Corsin, IDH
IDH Vietnam Manager Flavio Corsin speaks passionately about the importance of controlling disease and getting all stakeholders to put competition aside and pull on the same end of the rope. Improvement initiatives for pangasius, shrimp and tilapia are among the Dutch sustainable trade organization’s priorities.

Responsibility
Are global nutritional needs being met?
This study shows that the global agricultural system currently overproduces grains, fats and sugars while production of fruits and vegetables and protein [including seafood] is insufficient to meet the current population’s nutritional needs.
Aquafeeds
Can corn fuel aquaculture’s growth? Veramaris says yes
The benefits of omega-3 fatty acids to human health are well known. Fish need them too. To supplement current supplies from wild-caught fish, one innovative venture is turning to the corn fields of Nebraska – yes, Nebraska – for answers.