Consider feed quality, not just cost
Consider feed as the vehicle that carries your fish to the finish line
Farm managers and biologists rely on many metrics to assess animal growth performance and farm productivity. These include growth rate, feed conversion, muscle yield and viscera weight. These metrics measure the growth efficiency of the animals being reared. Measurements of feed use, electricity, fuel, labor, taxes and other expenses help determine the total cost of production.
All of these measurements should be used in making management decisions based on controlling costs. However, they should not be the primary factors in making feed purchase decisions. Feeding decisions based strictly on cost analysis can cause farms to purchase inexpensive, low-quality feed that cannot deliver optimum growth performance.
Growth cycles
Aquaculture growth has averaged 8.5 percent yearly for decades. When we look at this growth relative to advances in technology, we see the growth was not linear, but occurred as a series of technology jumps, each followed by a period of much slower growth until the next big breakthrough occurred. The lulls in growth were periods of diminishing returns during which the previous technology was being fine tuned and the next breakthrough was under development.
Aquafeed technology is currently passing through one of these periods of diminishing returns, and the market has filled with cheaper versions of the best-performing products. They claim to deliver the same performance for less. During these periods it takes greater investment for each unit of gain. As farm costs are increasingly scrutinized, it is common for feed to be viewed as a cost, not an investment.

Real value
When filling their vehicles with fuel, many people seek the cheapest fuel available. After all, any gas of equal octane should perform the same in our vehicles, regardless of price or brand.
However, when we purchase a new vehicle, we are often willing to pay a premium price for a vehicle that is capable of performing more efficiently or lasting longer. This new vehicle has value in which we are willing to invest.
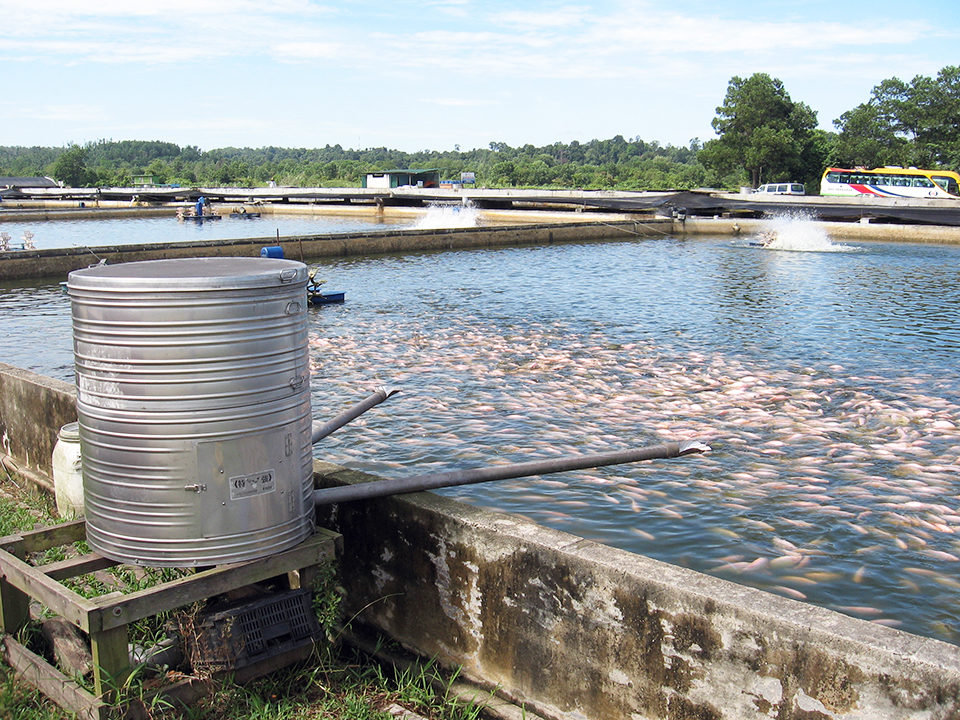
The common perception in aquaculture is that higher profits can be made by spending less money on feed. As in the fuel example, feed is often considered a commodity item. But try to consider feed as the vehicle that carries your fish to the finish line and therefore must provide value. That value comes in the form of rearing more fish to market size with less feed in less time.
Feed potential
Feed costs can contribute up to 60 percent of the expenses for an aquaculture business. It seems logical that a reduction in feed costs could significantly reduce overall costs and improve profits, but this is not the case. Farm profits can be improved significantly by using feeds that perform up to their potential.
How can you determine if your feed is performing up to its potential? The easiest way is to calculate the theoretical feed-conversion ratio (FCR) of your feed using the information provided on the feed label. The first step is to determine the digestible energy level of the diet (Table 1). Once this value is calculated, simple divide 3,745 (kcal required to rear 1 kg of fish) by the kcal/kg of your diet. For the example in Table 1, the theoretical FCR would be 1.24.
Snyder, Calculation of digestible energy, Table 1
| Nutrient | % of Feed | Digestible Energy (kcal/g) | Energy Content Contribution |
|---|---|---|---|
| Protein | 36 | 5.0 | 180.0 |
| Fat | 6 | 8.5 | 51.0 |
| Fiber | 4 | 0 | 0 |
| Moisture | 10 | 0 | 0 |
| Ash | 12 | 0 | 0 |
| Carbohydrates | 32 | 2.2 | 70.4 |
| Total | 100 | Per 100 g | 301.4 |
| Per lb | 1,368.0 | ||
| Per kg | 3,014.0 |
Feed as investment
Better-performing feeds cost more but can improve farm profitability. Spending less only leads to increased savings, not increased profits.
The example provided in Table 2 is data from an intensive farm raising tilapia in the United States. It shows a situation in which basing a feed decision on cost as opposed to profit potential could lead to the wrong decision.
Snyder, Profitability differences, Table 2
| Diet 36-6 | Diet 40-10 | Difference | Difference | |
|---|---|---|---|---|
| Input Data | ||||
| Animals stocked | 100,000 | 100,000 | – | 0 |
| Gain/day (g) | 2.94 | 3.35 | 0.41 | 13.9% |
| Average market weight (g) | 681 | 681 | – | 0 |
| Survival (%) | 98 | 98 | – | 0 |
| Feed-conversion ratio | 1.24 | 1.11 | (0.13) | -10.8% |
| Fingerling cost (U.S. $) | 0.09 | 0.09 | – | 0 |
| Initial weight (g) | 0.5 | 0.5 | – | 0 |
| Market value (U.S. $/kg) | 2.50 | 2.50 | – | 0 |
| Feed cost (U.S. $/kg) | 0.704 | 0.845 | 0.141 | 20.0% |
| Overhead/day/fish (U.S. $) | 0.0022 | 0.0022 | – | 0 |
| Calculations | ||||
| Days in cycle | 231.46 | 203.13 | (28.33) | -12.2% |
| Total weight (kg) | 66,738.00 | 66,738.00 | – | 0 |
| Value at market (U.S. $) | 166,845.00 | 166,845.00 | – | 0 |
| Cost of fingerlings (U.S. $) | 9,000.00 | 9,000.00 | – | 0 |
| Feed fed (kg) | 82,863.41 | 73,934.37 | (8,929.03) | -10.8% |
| Cost of feed (U.S. $) | 58,335.84 | 62,459.76 | 4,123.92 | 7.1% |
| Overhead costs (U.S. $) | 50,921.00 | 44,689.55 | (6,232,22) | -13.9% |
| Results | ||||
| Fingerling cost/kg marketed (U.S. $) | 0.135 | 0.135 | – | 0 |
| Feed cost/kg marketed (U.S. $) | 0.874 | 0.936 | 0.062 | 7.1% |
| Overhead cost/kg (U.S. $) | 0.763 | 0.670 | (0.093) | -12.2% |
| Profit | ||||
| Income over fingerling, feed and overhead costs | 48,587.39 | 50.695.69 | 2,108.30 | 4.3% |
| Other Factors/Adjustments | ||||
| Additional growth opportunity (U.S. $) | 4,744.98 | 14.1% | ||
| Advantage for 40-10 diet | 6,853.28 | 14.1% |
The goals of this facility were to shorten the production cycle, increase growth rate, reduce pollution and reduce total production costs. Several cost increases may catch your attention, such as the 20.0 percent difference in the feed prices, a 7.1 percent increase in total feed cost and a 7.1 percent increase in feed cost per kilogram of fish marketed. Most managers using these figures would conclude that having higher profits with a more expensive feed would not be possible.
However, better feed delivered several valuable returns that more than offset the increased costs. The feed-conversion ratio was improved by 10.8 percent, and the cycle was shortened 28 days. About 10.8 percent less feed was fed. Most significantly, total overhead costs were reduced by 13.9 percent.
Gross profits were improved by 4.30 percent, and if you factor in the value of the shorter cycle, the overall advantage can be valued as a 14.1 percent increase. Scrutinizing this feed decision from the standpoint of cost analysis clearly gave the wrong answer.
Next breakthrough
As aquaculture continues to grow, and we learn to increase the efficiency of our limited land, water and feed ingredient resources, we inadvertently dig ourselves a deeper hole with respect to the sustainability of aquaculture. The reliance of the aquafeed industry on marine ingredients for proteins and fats has decreased significantly over the last 20 years, but over the same time period, total aquaculture production has grown and effectively increased the use of marine-based ingredients. This is not a sustainable practice, nor will it allow aquaculture to take advantage of the 40-mmt seafood shortfall that is predicted by 2030.
Aquaculture is now big enough that science is breeding plants with nutrient profiles suited for aquaculture animals, and the algae industry is beginning to consider the aquafeed industry as a viable option for marketing their products and co-products. Only when aquaculture is trading in ingredients that are controlled by the aquaculture industry as opposed to relying on global commodities can aquaculture grow sustainably and push through this era of diminishing returns.
(Editor’s Note: This article was originally published in the September/October 2012 print edition of the Global Aquaculture Advocate.)
Now that you've reached the end of the article ...
… please consider supporting GSA’s mission to advance responsible seafood practices through education, advocacy and third-party assurances. The Advocate aims to document the evolution of responsible seafood practices and share the expansive knowledge of our vast network of contributors.
By becoming a Global Seafood Alliance member, you’re ensuring that all of the pre-competitive work we do through member benefits, resources and events can continue. Individual membership costs just $50 a year.
Not a GSA member? Join us.
Authors
-

Animal Nutritionist
Zeigler Bros., Inc.
P. O. Box 95
Gardners, Pennsylvania 17324 USA -

Senior Technical Advisor
Past President & Chairman
Zeigler Bros., Inc.
P. O. Box 95
Gardners, Pennsylvania 17324 USA
Related Posts
Health & Welfare
A holistic management approach to EMS
Early Mortality Syndrome has devastated farmed shrimp in Asia and Latin America. With better understanding of the pathogen and the development and improvement of novel strategies, shrimp farmers are now able to better manage the disease.
Aquafeeds
A look at protease enzymes in crustacean nutrition
Food digestion involves digestive enzymes to break down polymeric macromolecules and facilitate nutrient absorption. Enzyme supplementation in aquafeeds is a major alternative to improve feed quality and nutrient digestibility, gut health, compensate digestive enzymes when needed, and may also improve immune responses.
Health & Welfare
A look at tilapia aquaculture in Ghana
Aquaculture in Ghana has overcome its historic fits and starts and is helping to narrow the gap between domestic seafood production and consumption. Production is based on Nile tilapia.
Intelligence
Adding value to tilapia to tap into U.S. market
New markets for tilapia and expansion of existing ones can be created by planning and implementing properly designed geographic strategies to meet discriminating consumer preferences. Low labor costs in most producing countries promotes value-adding by the production of fresh fillets.