Consumers’ salmon perceptions relate to consumption frequency
Perceptions influence consumers’ purchasing decisions
It is important to understand consumer perceptions of seafood, as in combination with the importance consumers assign for each quality dimension, they influence consumers’ willingness to consider fish as a viable alternative to other competing products and, ultimately, their purchase decisions.
In the September/October 2012 issue of the Global Aquaculture Advocate, the authors presented the results of a study of consumers from five European countries that showed salmon was regarded as superior in healthiness compared to other meat, considered to have good taste in most countries, and mostly regarded as convenient. On the other hand, consumers in all countries rated salmon lower on availability and value compared to other meat categories.
Another study by the authors differentiated consumers by how often they ate salmon and examined the differences in their preferences regarding various salmon traits.
Data setup
Consumers were divided into three groups: frequent users, consumers who eat salmon more than once every two weeks; infrequent users, consumers who eat salmon between once a month or more than once a year; and non-users, consumers who eat salmon once a year or less. Fig. 1 shows the distribution of these groups in the study sample of around 2,500 households in five countries.
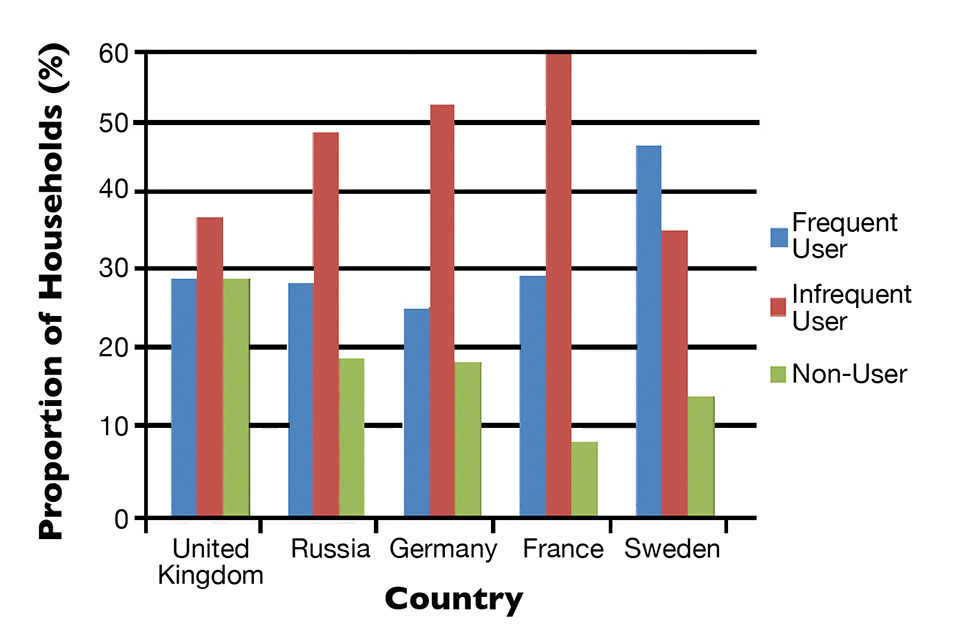
There were definite variations across countries, with Sweden having the largest share (48 percent) of households in the frequent user group and Germany the lowest share (27 percent). The United Kingdom had the highest share (31 percent) of households in the non-user group, while France showed only 10 percent non-users. Overall, 33 percent of households were in the frequent user group, 47 percent were infrequent users, and 19 percent were in the non-user group.
Positioning
Our understanding of the opportunities and barriers facing farmed seafood products depends on understanding seafood positioning among consumers. “Positioning” in this context refers to how consumers perceive products and their relation to competing products.
In the case of salmon, quality is judged based on multidimensional characteristics, such as taste, convenience, availability, healthiness and the price-quality relationship or “value.” As such, the perceptions formed within consumers’ minds are also multidimensional.
Consumer positioning
Consumers in five countries were asked to rate salmon and other protein choices in five dimensions – taste, healthiness, value, convenience and availability – on a scale from 1 to 7, where 7 was the highest score. Not surprisingly, the position of salmon in consumers’ minds was stronger for all dimensions among frequent users than in infrequent users and non-users.
In other words, there was a strictly positive relationship between consumption frequency and the average position of salmon in the dimension areas surveyed. A smaller position gap was identified between frequent and infrequent users than between infrequent users and non-users.
Position gaps
Fig. 2 examines the position gaps among the three consumption frequency groups by plotting the difference in average position for all five dimensions between frequent users and infrequent users. For example, if the average score was 6 for frequent users and 5 for infrequent users, the difference was 6 – 5 = 1.
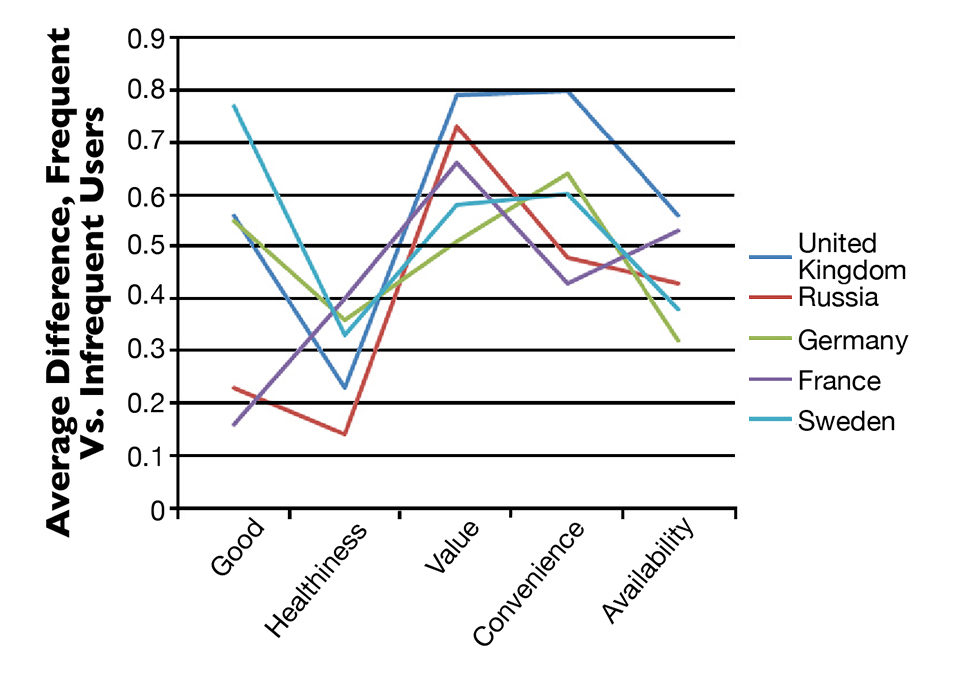
The difference between frequent and infrequent users was largest for value, although with some variation across countries. Furthermore, the average difference was small for all position traits, less than one unit for all countries on this scale from 1 to 7. The average difference between frequent users and infrequent users was also large for convenience. On the opposite end was healthiness, for which the average difference between frequent and infrequent users was less than 0.4 in all countries.
Fig. 3 shows a much bigger difference in salmon’s position between frequent and infrequent users. This was particularly the case for taste, where differences ranged from around one unit in Russia to three units in Sweden, the U.K. and Germany. For the other dimensions, the average differences were smaller, but still significant in many cases. Salmon Vs. Other Proteins An increase in household consumption of salmon has to be at the expense of other proteins from sea or land. Since chicken, pork and beef represent the main share of protein intake for the typical household, the authors analyzed the positioning of salmon for the three consumption frequency groups.
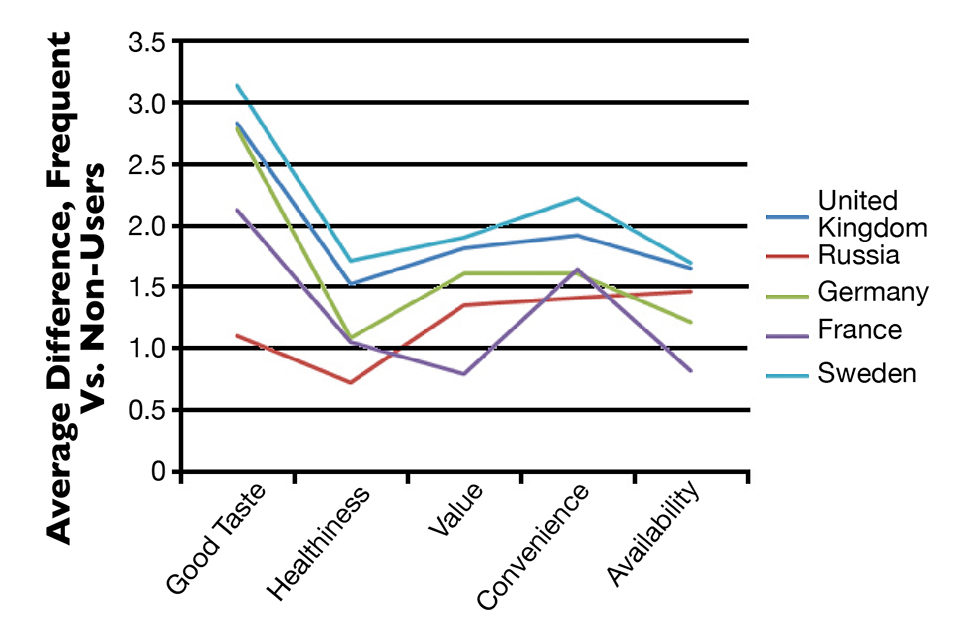
Fig. 4 shows the average difference between salmon and chicken scores in the dimensions of taste, healthiness, value, convenience and availability for all five countries. Only for frequent users was the position of salmon similar to that of chicken. Salmon scored slightly higher than chicken on taste and healthiness, and slightly lower on value and availability.
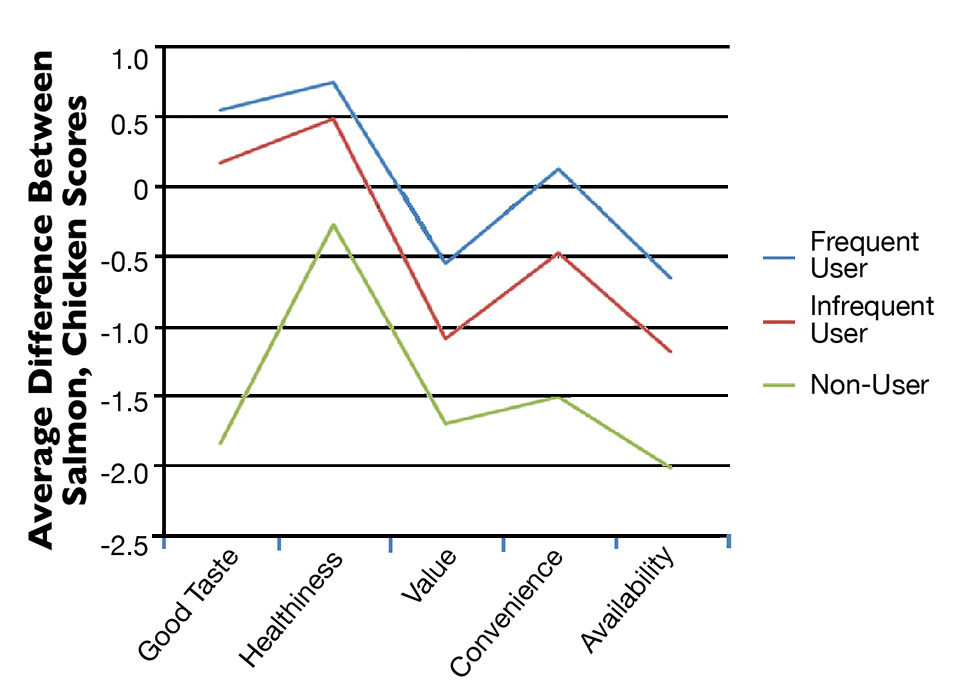
The position of salmon relative to chicken deteriorated for the less-frequent salmon consumers. For non-users, there was not a significant difference in healthiness, but salmon ranked significantly lower than chicken in the other dimensions.
A similar picture emerged when the position of salmon was compared to that of pork, as shown in Fig. 5. However, the relative position of salmon was stronger than we saw in the comparison with chicken. For the frequent user group, salmon had significantly stronger positions than pork for healthiness and taste. Except for availability, the score was higher than for pork.
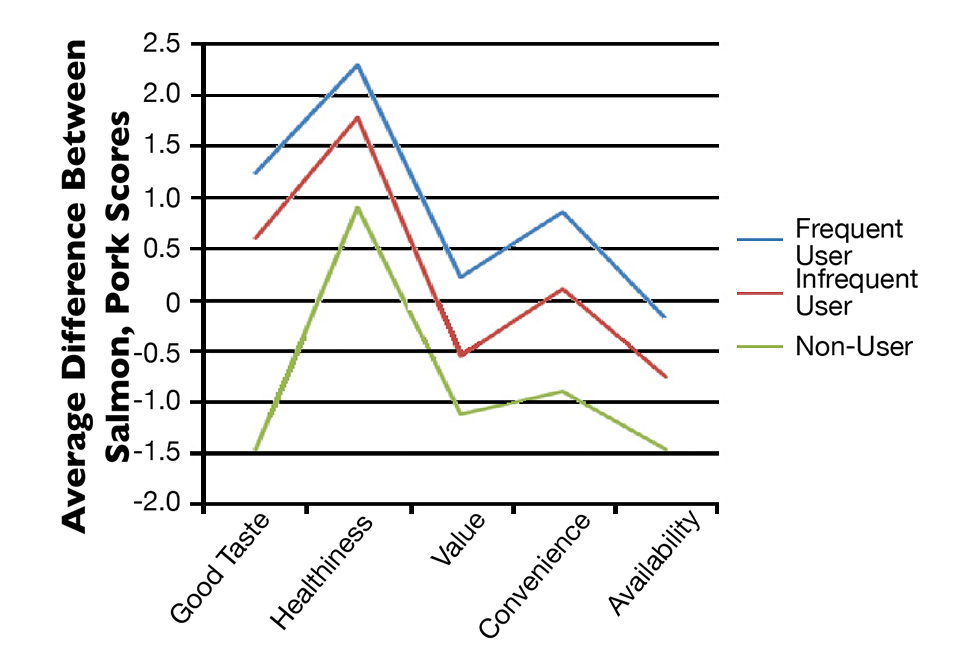
But again, the relative position deteriorated in the infrequent non-user groups. Among non-users, salmon scored higher than pork only in the healthiness dimension, and was weaker in the other dimensions.
In comparing consumer positions on salmon and beef, the picture was similar to that of pork. Salmon had a generally favorable position for frequent users and the infrequent user group. But for non-users, the position was weaker, except for healthiness.
Perspectives
Companies and other agents in the entire salmon value chain need to be involved in actions to improve the position of salmon. Both private and collective “generic” investments are necessary.
Potential measures include product development to improve convenience in meal preparation, improving the availability of salmon products in stores and communications to consumers to improve their preparation skills for salmon-based meals.
There are several reasons to be optimistic. The younger salmon value chain has more unexploited opportunities than the more mature terrestrial meat sectors in distribution, product development and communication, and can also learn from the best practices and innovations in these sectors.
(Editor’s Note: This article was originally published in the November/December 2012 print edition of the Global Aquaculture Advocate.)
Authors
-

University of Stavanger
4036 Stavanger, Norway -

University of Stavanger
4036 Stavanger, Norway -

University of Stavanger
4036 Stavanger, Norway
Related Posts
Intelligence
A land grab for salmon (and shrimp) in upstate New York
The operators of Hudson Valley Fish Farm see their inland locale as a pilot to prove that land-based fish farming, located in close proximity to major metropolitan markets, can be successful.

Innovation & Investment
AquaBounty, with new RAS facility, hopes to win public support for GM salmon
Ron Stotish, CEO of AquaBounty Technologies, believes genetically modified salmon is no threat to its opponents and the outlook for AquAdvantage is good. With its purchase of the Bell Fish Co. RAS facility, commercialization will soon commence.
Intelligence
Consumer survey explores farmed, wild seafood perceptions
What do shoppers really think about farmed and wild seafood? Commissioned by The Fishin’ Co. and the Global Aquaculture Alliance, an extensive survey conducted earlier this year sought to determine the key drivers in consumers’ seafood purchasing habits and their perception of aquaculture.

Intelligence
Changes in European consumer perceptions of farmed salmon
Household surveys have been carried out annually since 2012 in France, Germany and the UK on perceptions and consumption patterns for salmon and meat from agriculture. Results show that salmon is generally perceived as having more beneficial effects than chicken on brain development, bone development, certain cancer risks and coronary heart disease risk.