Economic analyses project rising returns for intensive biofloc shrimp systems
Trial systems have yet to conduct regular production cycles
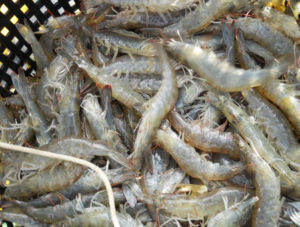
Production of shrimp in indoor super-intensive recirculating systems can produce large quantities of shrimp, but can have high initial investment and operating costs. Economic analyses of 2012 trials from two different production systems at the Texas A&M AgriLife Research Mariculture Lab at Flour Bluff, Corpus Christi, Texas, have been very encouraging.
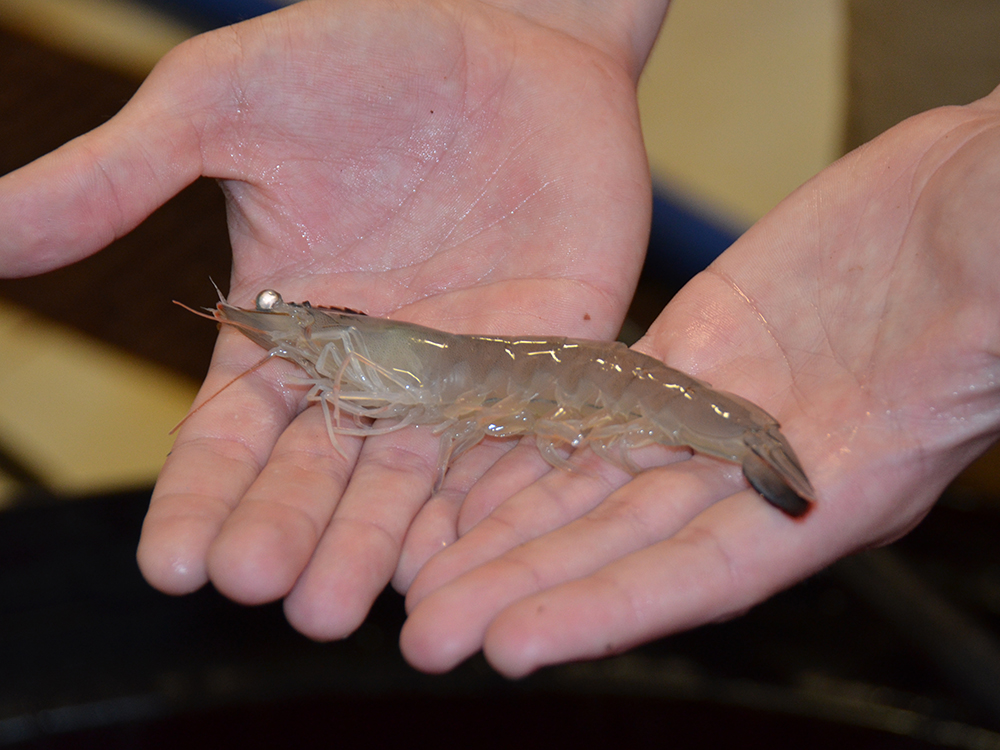
The first study compared a commercial 35 percent-crude protein feed formulated for use in biofloc-dominated, super-intensive, zero-exchange systems (HI-35, U.S. $1.75/kg) and a standard 35 percent-protein feed formulated for semi-intensive shrimp production (SI-35, $0.99/kg). Each treatment was conducted in three, 40-m3 raceways using juvenile Litopenaeus vannamei from a cross between fast-growth and Taura-resistant genetic lines.
The second experiment used only the HI-35 feed and was run in two, 100-m3 raceways with the same strain of shrimp. The performance of these systems is compared to that of the best trial in 2011 in Table 1. The best 2011 trial results came from a “fast-growth” line fed an HI-35 feed.
Hanson, Summary of production for super-intensive recirculating shrimp production systems, Table 1
| Treatment | 2011 | HI-35 40 m3 | SI-35 40 m3 | HI-35 100 m3 |
|---|---|---|---|---|
| Stocking density (juveniles/m3) | 500 | 500 | 500 | 500 |
| Survival rate (%) | 81.6 | 87.3 (+7.0%) | 88.2 (+8.1%) | 79.5 (-2.6%) |
| Growth rate (g/week) | 1.85 | 2.03 (+9.7%) | 1.76 (-4.9%) | 2.13 (+15.1%) |
| Stocking size (g) | 1.8 | 2.7 (+50%) | 2.7 (+50%) | 3.6 (+100%) |
| Harvest size (g) | 23.6 | 22.3 (-5.5%) | 19.8 (-16.1%) | 22.7 (-3.8%) |
| Feed-conversion ratio | 1.43 | 1.25 (-12.6%) | 1.43 (0%) | 1.48 (+3.5%) |
| Crop length (days) | 83 | 67 (-19.3%) | 67 (-19.3%) | 63 (-24.1%) |
| Production (kg/m3) | 9.58 | 9.74 (+1.7%) | 8.71 (-9.1%) | 9.03 (-5.7%) |
Data analyses
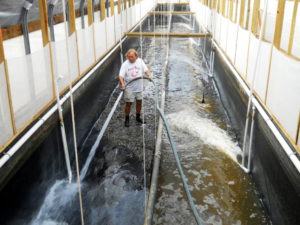
By extrapolating production results into the context of a commercial facility, 10-year cash flows and enterprise budgets were developed to provide comparable financial indicators of profitability. For this hypothetical analysis, one greenhouse system contained 10 raceways: eight 500-m3 growout raceways and two 500-m3 raceways used as nurseries to grow 10-day-old postlarvae (P.L.10) to 2.7-g or 3.6-g juvenile shrimp.
Analyses included a fixed cost component covering construction and equipment/machinery costs for an initial investment of approximately U.S. $992,000. Other critical prices and costs included the selling price of shrimp ($7.20/kg), the two diets (see prices above), juvenile production costs of $20/1,000 P.L.10 and an interest rate of 8 percent for operating, equipment and construction loans.
The economic questions answered by this analysis were whether the production results were financially positive, given that one feed was much more expensive than the other, and secondly, was the progress made between the 2011 and 2012 trials improving the profitability of the super-intensive, recirculating shrimp production systems.
Results
As shown in Table 1, each trial had the same stocking rate of 500 juveniles/m3. The juvenile shrimp stocking size was 50 percent larger for the two 40-m3 trials and 100 percent larger in the HI-35 100-m3 trial compared to the 2011 juvenile stocking size.
The growth rates increased by 9.7 percent and 15.1 percent for the HI-35 40 m3 and HI-35 100 m3 trials, respectively, when compared to the 2011 trial, while the SI-35 40 m3 growth rate decreased by 4.9 percent when compared to the 2011 trial. The survival rates improved by 7.0 percent and 8.1 percent from the 2011 trial to the HI-35 40 m3 and SI-35 40 m3 trials, respectively, while the HI-35 100 m3 trial saw a decrease in survival of 2.6 percent from the 2011 trial.
The harvest sizes in the 2012 trials decreased by 5.5, 16.1 and 3.8 percent for the HI-35 40 m3, SI-35 40 m3 and HI-35 100 m3 trials, respectively. The production per cycle was slightly greater for the HI-35 40 m3 trial compared to the 2011 trial, 9.1 percent lower for the SI-35 40 m3 treatment and 5.7 percent lower in the HI-35 100 m3 trials. But, put into perspective, production above 9 kg/m3 is very good.
The feed-conversion ratios (FCRs) improved by 12.6 percent for the HI-35 40 m3 trial compared to the 2011 trial. There was no difference in FCR values between the 2011 trial and the 2012 SI-35 40 m3 trial, and there was a poorer FCR for the HI-35 100 m3 trial compared to the 2011 trial.
Shorter cycles
The positive effects from increased stocking size, growth rate and survival resulted in a reduced crop duration time. In all cases, the 2012 trials had shorter crop durations, which leads to more crops per year. There were 19.3 percent, 19.3 percent and 24.1 percent reductions in crop days between the 2011 trial and the HI-35 40 m3, SI-35 40 m3 and HI-35 100 m3 trials, respectively.
These reductions resulted in 5.5 crops/year for the HI-35 40 m3 and SI-35 40 m3 trials, a 25 percent increase over the 2011 trial’s 4.4 crops/year; and a 32 percent increase to 5.8 crops/year for the HI-35 100 m3 trial compared to the 2011 trial.
In Table 2, production and sales information is presented for the 2011 trial and the three 2012 trials. The combination of improvement in several production factors resulted in more total production and sales for the two HI-35 trials and the SI-35 40 m3 trial over the 2011 trial.
Hanson, Summary of production and sales for extrapolated super-intensive recirculating shrimp production systems, Table 2
| Treatment | 2011 | HI-35 40 m3 | SI-35 40 m3 | HI-35 100 m3 |
|---|---|---|---|---|
| Production (kg/crop) | 38,320 | 38,960 | 34,840 | 36,120 |
| Annual crops | 4.4 | 5.5 | 5.5 | 5.8 |
| Production (kg/year) | 168,608 | 214,280 | 191,620 | 209,496 |
| Selling price (U.S. $/kg) | 7.20 | 7.20 | 7.20 | 7.20 |
| Total annual sales (U.S. $) | 1,213,978 | 1,542,816 | 1,379,664 | 1,508,371 |
In Table 3, a summary enterprise budget based on 2011 and 2012 results indicates a positive net return. The three 2012 trials had greater than U.S. $2.00/kg returns, with the HI-35 40 m3 trial having a $2.67/kg net return. The 2012 trials had variable production costs of $0.84-1.32/kg less than the 2011 trial’s costs. Likewise, the payback period was one to 1.5 years less for the 2012 trials than for the 2011 trial. All net present values were two to nearly three times greater than those for the 2011 trial, and the internal rate of return for the 2012 trials ranged from 50.1 to 66.6 percent – much higher than the 33.1 percent return for the 2011 trial.
Hanson, Summary enterprise budgets, Table 3
| 2011 | HI-35 40 m3 | SI-35 40 m3 | HI-35 100 m3 | |
|---|---|---|---|---|
| Gross receipts (U.S $/kg) | 7.20 | 7.20 | 7.20 | 7.20 |
| Variable costs (U.S $/kg) | 5.38 | 4.06 | 4.54 | 4.31 |
| Income above variable costs (U.S $/kg) | 1.82 | 3.14 | 2.66 | 2.89 |
| Fixed costs (U.S $/kg) | 0.59 | 0.47 | 0.53 | 0.48 |
| Total specified expenses (U.S $/kg) | 5.97 | 4.53 | 5.07 | 4.79 |
| Net returns (U.S $/kg) | 1.23 | 2.67 | 2.13 | 2.41 |
| Payback period (years) | 2.9 | 1.4 | 1.9 | 1.6 |
| Net present value (U.S. $, million) | 1.0 | 2.9 | 2.0 | 2.6 |
| Internal rate of return (%) | 31.3 | 66.6 | 50.1 | 60.6 |
The more-expensive diet, HI-35, financially outperformed the lower-priced SI-35 feed in the 40-m3 and 100-m3 raceways. The improvements in 2012 also resulted in much better financial performance.
Perspectives
The highly favorable financial results for the 2012 trials need to be considered with caution, as major assumptions were used in this analysis. First, the model assumed a readily available year-round PL10 supply, which may be difficult in the continental U.S. It was assumed there would be a stable market price for the product over the 10-year period of the simulation. Also, research trials using these systems have yet to actually conduct back-to-back production cycles.
One research crop a year is an accomplishment, but to actually conduct 5.8 crops annually, the result for the HI-35 100 m3 trial, with the same high level of results is much more difficult to achieve.
These caveats are large and need to be addressed. However, the financial analyses conducted here using a tested bioeconomic model can help researchers focus on improvements that provide the most return and sharpen the competitiveness of these intensive biofloc shrimp systems.
(Editor’s Note: This article was originally published in the July/August 2013 print edition of the Global Aquaculture Advocate.)
Authors
-

Department of Fisheries and Allied Aquacultures
Auburn University
203 Swingle Hall
Auburn, Alabama 36849 USA -
Texas A&M AgriLife Research Mariculture Lab at Flour Bluff
Corpus Christi, Texas, USA -
Texas A&M AgriLife Research Mariculture Lab at Flour Bluff
Corpus Christi, Texas, USA -
Texas A & M AgriLife Research Mariculture Lab at Flour Bluff
Corpus Christi, Texas, USA -
Estação Marinha de Aquacultura
Instituto de Oceanografia
Universidade Federal do Rio Grande
Rio Grande, Brazil -
Estação Marinha de Aquacultura
Instituto de Oceanografia
Universidade Federal do Rio Grande
Rio Grande, Brazil
Related Posts
Aquafeeds
Biofloc and clear-water RAS systems: a comparison
This study compared two types of indoor, shrimp culture systems: clear-water RAS and biofloc systems. Clearwater RAS had the edge in water quality, but shrimp in the biofloc treatment had a higher feed conversion ratio.
Aquafeeds
Biofloc consumption by Pacific white shrimp postlarvae
The stable isotopes technique with δ13C and δ15N can be used to determine the relevance of different food sources to shrimp feeding during the pre-nursery phase of Litopenaeus vannamei culture. During this trial, different types of commercial feed, microalgae, Artemia sp. nauplii and bioflocs were used as food sources.

Health & Welfare
Biofloc technology holds potential for carnivorous fish species
Juvenile carnivorous African catfish performed well in biofloc-based systems, which could help produce better quality and more disease-resistant seed of this important aquaculture species and support the expansion of African catfish farming industry.
Intelligence
Biofloc technology production promising in temperate zones
A study was conducted to assess the feasibility to grow Channel catfish (Ictalurus punctatus) in an outdoor biofloc system during winter in a temperate zone. High biomasses of market-size channel catfish were successfully maintained through the winter with high survival and in good condition in both treatments.