Effluent effects from aquaculture ponds
Pollution loads vary by system, other factors
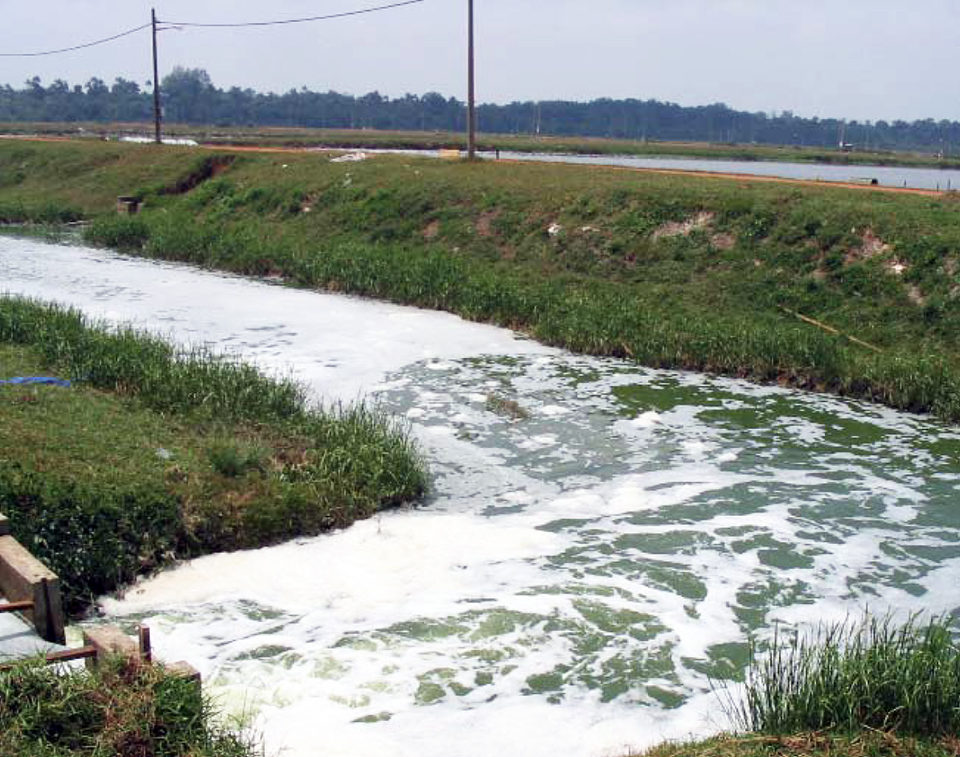
The effects of effluents on water bodies are difficult to accurately predict because several interacting variables come into play. The amount or load of a pollutant depends upon both the effluent volume and the pollutant concentration. The probable effects of effluents on receiving water bodies depend not only upon the pollution load but also the rate at which the pollutants can be assimilated.
If the pollution load does not exceed the assimilation capacity of the receiving water body, negative impacts do not occur, except possibly in the zone where the effluent initially mixes with the receiving water. This is the reason high pollutant concentrations should be avoided, even for effluents of small volumes and pollutant loads.
Cumulative effects
The effects of effluents on receiving waters vary from no impact to severe degradation of one or more aspects of water quality. These effects can be insidious, because pollution loads often gradually increase, and negative effects are not observed until the loads finally exceed the assimilative capacity and cause water quality to deteriorate.
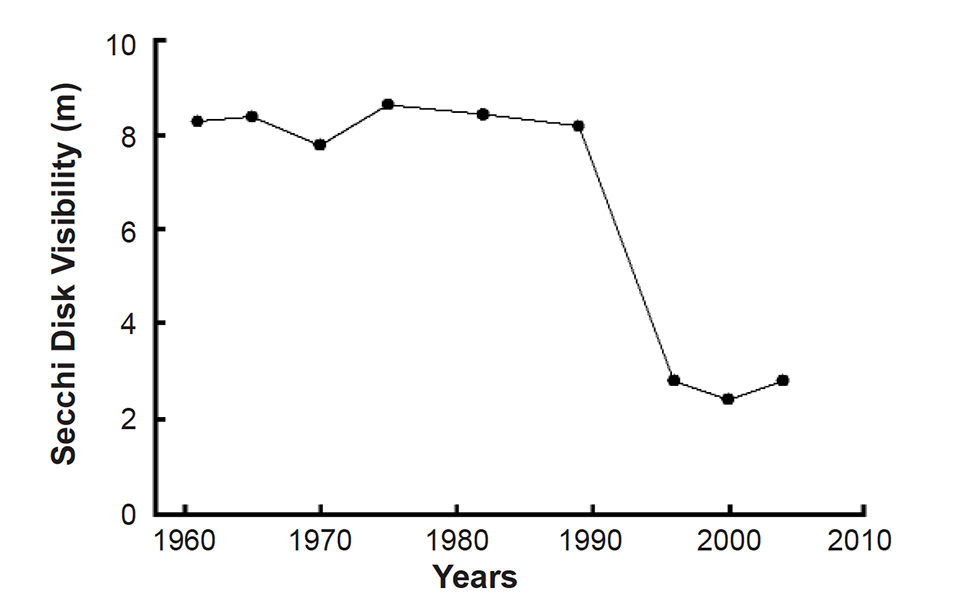
For example, nutrient inputs to lakes may increase over many years, but the onset of dense phytoplankton blooms and other symptoms of eutrophication can be sudden. Fig. 1 illustrates this phenomenon for a lake in a rural area where the human inhabitants of the watershed have steadily increased for years. The lake traditionally had clear water with high Secchi disk visibility, but nutrient inputs increased until a rather abrupt increase in turbidity resulted from phytoplankton blooms, signaling that the lake had become eutrophic.
Limited understanding
It often is difficult to have a meaningful dialogue about the effects of aquaculture effluents on a given water body because stakeholders do not understand how to relate information on sources and amounts of pollutants to possible environmental outcomes. The concentrations and quantities of nutrients, organic matter, and suspended solids in aquaculture effluents entering a water body may be known. However, the information needed to compare the pollution load from aquaculture with other sources of pollution usually is lacking, and the assimilative capacity of the water body is seldom known. Furthermore, unless changes in water quality are obvious, some stakeholders assume that pollution is not occurring.
Domestic waste
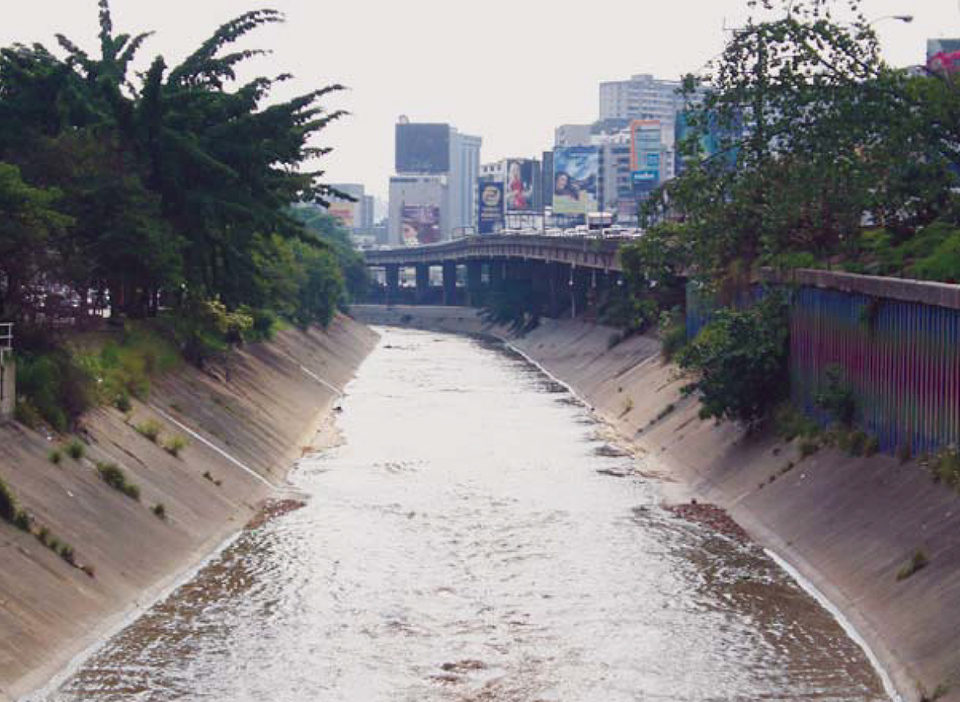
Domestic waste water is a common source of pollution that increases in direct proportion to the number of humans who comprise the source. Most stakeholders are aware of this, but those who are not can be easily convinced that the degree of pollution of water bodies tends to increase in proportion to the size of the human populations of catchment areas. Many aquaculturists express concern about the possible effects of pollution from towns and villages near fish and shrimp farms.
Table 1 provides data on the typical per-capita contribution of selected pollutants to sewage by humans. As expected, those living in developed countries tend to generate larger amounts of pollutants than those in developing countries.
Boyd, Typical waste water constituent data, Table 1
| Parameter | Developed Nations Range | Developed Nations Mean | Developed Nations Range | Developed Nations Mean |
|---|---|---|---|---|
| Biochemical oxygen demand | 49.00-120.00 | 62.50 | 27.0-68.0 | 50.60 |
| Total suspended solids | 55.00-96.00 | 88.20 | 41.0-72.0 | 44.80 |
| Total Kjeldahl nitrogen | 1.00-22.00 | 11.50 | 4.0-14.0 | 9.90 |
| Total phosphorus | 0.15-4.50 | 2.48 | 0.4-2.0 | 0.55 |
The average annual contributions for developing and developed nations, respectively, are as follows: biochemical oxygen demand (BOD), 18.5 kg and 22.8 kg; total suspended solids (TSS), 16.4 kg and 32.2 kg; total Kjeldahl nitrogen (TKN), 3.62 kg and 4.20 kg; and total phosphorus, 0.20 kg and 0.91 kg.
Aquaculture waste
These human contributions to sewage can provide perspective on the amount of waste generated by aquaculture facilities. For example, in closed-system shrimp production, effluents are released only when ponds are drained for harvest. A 1-hectare pond with a depth of 1.5 meters might produce 4 metric tons (MT) of shrimp per crop twice a year. The total volume of waste water would be 30,000 cubic meters.
The increase in concentrations of water quality variables in pond water as a result of shrimp aquaculture typically is about 10 milligram per liter BOD, 15 milligram per liter TSS, 3 milligram per liter TKN, and 0.3 milligram per liter total phosphorus. Thus, the annual amounts of pollutants per ton of shrimp are about 37.5 kg of BOD, 56.2 kg of TSS, 11.25 kg of TKN, and 1.12 kg of phosphorus. The human population equivalents per ton of shrimp for the farm effluent in a developing nation would be 2.05 kg for BOD, 3.42 for TSS, 3.1 for TKN, and 5.6 for total phosphorus.
A farm producing 500 MT shrimp per year would have a phosphorus load in effluents equal to the phosphorus pollution potential of a town of 2,800 inhabitants. The water pollution load of shrimp farming in a country producing 100,000 MT of shrimp annually using closed systems would be equal to that of 205,000 to 560,000 inhabitants, depending upon the variable selected for the comparison.
Semi-intensive, cage culture
The population equivalent of the effluent from shrimp farming would be much greater at farms where water exchange is used, for organic matter, suspended solids, and nutrients would be flushed from ponds rather than assimilated within them. Studies have shown that semi-intensive shrimp culture ponds with 10 to 20 percent daily water exchange can release 7 or 8 kg phosphorus per MT of shrimp as compared to 1.12 kilograms per MT in the example above.
The pollution load from cage or raceway culture is much greater than for pond culture because these systems do not assimilate waste within the culture units. As a reference, 1 MT of tilapia production has been estimated to release 65.1 kg of TKN and 9.1 kg of total phosphorus to the water.
In a developing nation, a tilapia cage culture operation producing 5,000 MT per year would discharge TKN equivalent to 89,917 humans and total phosphorus equal to 227,500 people. The tilapia farm would deliver a pollution load to a lake equal to that imposed by a small city. However, if the lake can assimilate the wastes, water quality would not deteriorate.
Trout production is conducted most frequently in developed nations. Typical waste production in raceways for trout has been reported as 1,156 kg of TSS, 315 kg of BOD, 50 kg of TKN, and 13.9 kg of phosphorus per ton of fish. The human population equivalents per metric ton of trout are 35.9, 13.8, 11.9, and 15.2 kg, respectively. Obviously, a fairly large trout farm also would be equal to a small city in terms of pollution potential.
Varied sources
Comparing the water pollution potential of aquaculture facilities to that of human populations clearly demonstrates that aquaculture can be a significant source of pollution. Aquaculture facilities should not be singled out as pollution sources, however, for pig farms, chicken houses, and cattle feed lots also generate wastes.
Evidence is lacking to show that aquaculture is a more concentrated source of pollution than other kinds of animal production. On the contrary, the water released from most aquaculture facilities usually has rather low concentrations of pollutants as compared to other effluents. For example, raw human sewage typically has a BOD of 250 to 500 milligram per liter, while pond effluents usually contain less than 20 milligram per liter BOD.
In spite of low pollutant concentrations, aquaculture facilities often have large volumes of effluents that result in significant pollution loads. Fortunately, the negative environmental impacts of aquaculture can be avoided or lessened through selection of good sites, limits on production, and use of good management practices.
(Editor’s Note: This article was originally published in the June 2006 print edition of the Global Aquaculture Advocate.)
Now that you've reached the end of the article ...
… please consider supporting GSA’s mission to advance responsible seafood practices through education, advocacy and third-party assurances. The Advocate aims to document the evolution of responsible seafood practices and share the expansive knowledge of our vast network of contributors.
By becoming a Global Seafood Alliance member, you’re ensuring that all of the pre-competitive work we do through member benefits, resources and events can continue. Individual membership costs just $50 a year.
Not a GSA member? Join us.
Author
-

Department of Fisheries and Allied Aquacultures
Auburn University
Alabama 36849 USA
Related Posts
Responsibility
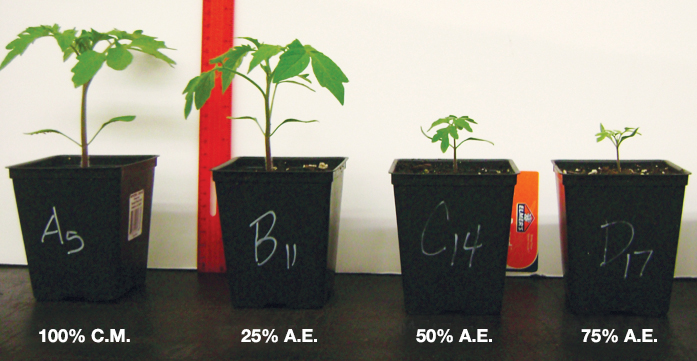
Aquaculture effluent partially replaces growing mix for plant production
Aquaculture effluent can be an effective fertilizer in land-based plant production. Research with tilapia utilized dewatered aquaculture effluent (A.E.) as a partial substrate replacement for tomato plant seedlings. Seedling growth decreased when effluent replaced a commercial growing mix at 25 percent or more.
Responsibility
A look at unit processes in RAS systems
The ability to maintain adequate oxygen levels can be a limiting factor in carrying capacities for RAS. The amount of oxygen required is largely dictated by the feed rate and length of time waste solids remain within the systems.
Responsibility
A look at various intensive shrimp farming systems in Asia
The impact of diseases led some Asian shrimp farming countries to develop biofloc and recirculation aquaculture system (RAS) production technologies. Treating incoming water for culture operations and wastewater treatment are biosecurity measures for disease prevention and control.

Innovation & Investment
A review of unit processes in RAS systems
Since un-ionized ammonia-nitrogen and nitrite-nitrogen are toxic to most finfish, controlling their concentrations in culture tanks is a primary objective in the design of recirculating aquaculture systems.