Feeds affect lipid body composition, quality
Higher lipid concentration can increase oxidation, affecting fish health and contribute off-flavors
An understanding of the final carcass composition of fish can facilitate the development of an optimized feeding regimen and enable the production of fish with the best possible nutritional profile to meet consumer demands. However, fish composition can be influenced by a variety of factors.
For example, composition varies by species, but even strains within a fish species can have a significantly different composition. Carcass composition is also influenced by environmental conditions. Some of the changes occur rapidly, while others can happen over an extended time interval. Feeding intensity and nutrient composition have the greatest influence on carcass composition.
Fatty acid benefits
Today’s consumers prefer fish high in the omega-3 fatty acids or omega-3 polyunsaturated fatty acids (PUFAs) due to their dietary importance. PUFAs include eicosapentaenoic acid (EPA – 20:5 omega-3) and docosahexaenoic acid (DHA – 22:6 omega-3).
Studies agree that increased fish consumption in humans is associated with decreased mortality, as well as reduced morbidity from cardiovascular disease, coronary heart disease and thrombotic strokes. Recent findings have shown that consumption of fish high in omega-3s promotes increased brain function in children and improves eye development in infants.
The desirability of fish as food is strongly dependent on the fatty acid composition of the fish. The fatty acid profiles of fish can be modified with diets containing alternative lipid sources. When the optimal concentrations of omega-3/omega-6 PUFAs are determined for humans, fish can be produced with optimum lipid content and omega-3:omega-6 ratios tailored to the nutritional needs of consumers.
Fish oil or plant oil?
A large portion of the global fish oil production is used to accommodate the growing aquaculture industry. Plant oils stand out as the most likely candidates to substitute for fish oils in fish feeds. The total global production of plant oils is around 100 times higher than that of fish oils, and a number of studies have demonstrated that plant oils can replace a significant portion of the fish oil in aquaculture diets without compromising growth, feed efficiency or reproduction.
However, in general, the substitution of plant oil for fish oil has resulted in a lower level of long-chain n-3 fatty acids, including EPA and DHA, and higher levels of the C18 fatty acids (oleic acid, linoleic acid and linolenic acid).
Feed effects: body composition
Feeding trials with carp (Cyprinus carpio L.) in which various protein levels ranging from 20 to 41 percent and energy levels from 17 to 20 MJ/kg dry matter were included in the diet, produced significant changes in the carcass composition. Variations in the protein content did not yield a significant change in composition, but energy levels influenced all parameters examined.
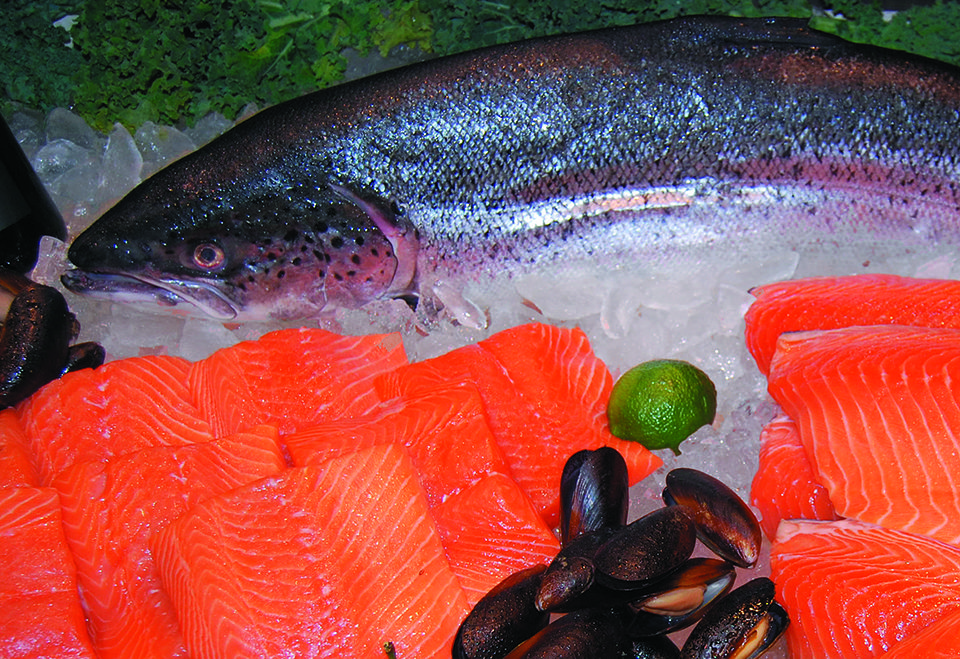
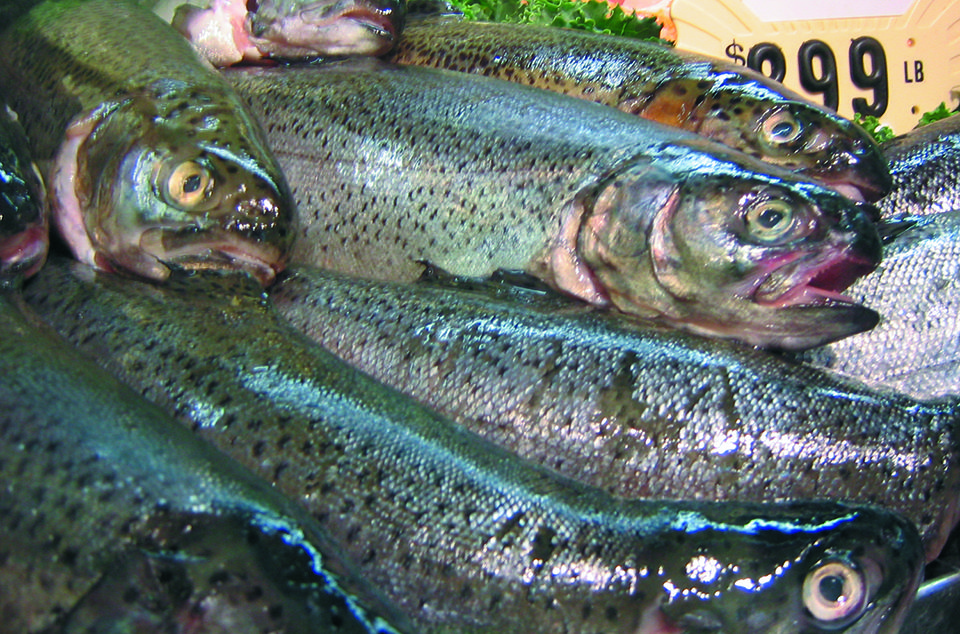
Of all the nutrients, the carcass fat content showed the greatest differences, varying from 6.7 to 17.6 percent. The differences in the protein content were much less significant (14.2 to 16.1 percent), and ash content was also similar (2.5 to 3.1 percent). The energy content of the carcasses varied from 24.4 to 28.3 MJ/kg. The total amount of fat deposited in the flesh of some farmed fish, especially Atlantic salmon, is among the most important quality attributes. It has been shown that increased fillet lipid content also increased the juiciness of rainbow trout muscle.
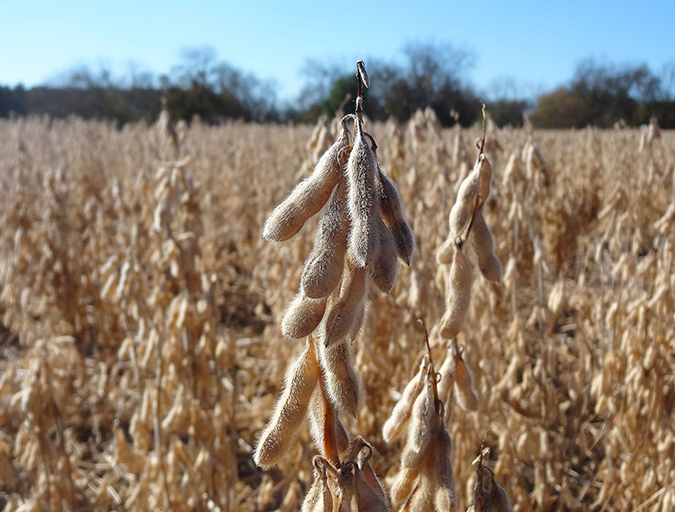
In further research, experimental fishmeal-based isonitrogenous and isolipidic diets containing added fish oil (F.O.), soybean oil (S.O.) or linseed oil (L.O.) were fed to turbot (Psetta maxima). The total lipid content was higher in the ventral muscle than the dorsal muscle. Muscles of fish fed the S.O. diet were rich in 18:2 omega-6 (linoleic) fatty acids, whereas fish fed the L.O. diet were rich in 18:3 omega-3 (rumelenic acid) fatty acids. The muscle of fish fed S.O. and L.O. diets had lower levels of 20:5 omega-3 and 22:6 omega-3 fatty acids in comparison to those fish fed the F.O. diet.
The gutted and fillet yields were not affected by the incorporation of vegetable oils. However, the soybean oil and linseed oil significantly affected the sensory qualities of the muscle tissue, particularly odor, color and texture. A “potato” odor in the dorsal fillets was more pronounced in fish fed the S.O. diet than in the other groups. The odor was of equal intensity in all three diets in the ventral fillets.
A “fish” odor was more intense in fish fed the F.O. diet. Mouth feel was also affected by diet, with fish fed the S.O. and L.O. diets rated inferior to fish fed the F.O. diet. Fat texture was significantly different among the three diets. Fish fed the F.O. diet had a fattier texture. However, the compositional differences among diets disappeared when the fish were removed from the S.O. and L.O. diets and fed only the F.O. diet for two months prior to harvest.
While including a higher amount of lipids in the diet generally facilitates a desirable compositional change in fillets, there are some drawbacks. The visceral somatic index and viscera lipid concentration have been shown to increase with increasing dietary lipid concentration.
At present, fish viscera are most often discarded as a by-product of processing. Therefore, the increase in viscera lipids presents an economic concern for fish processors due to the increased volume of by-product that is generated, which is usually discarded at a cost, and the waste of digestible calories from feed. Another disadvantage is the potential for increased lipid oxidation in feed and fish fillets during storage.
Feed effects: lipid composition
In a study, brown trout (Salmo trutta) were fed five dietary lipid sources: fish oil, canola oil (C.O.), poultry fat, pork lard and olein oil (O.O.) over 70 days. The proximate compositions of the resulting fish fillets (Table 1) were not significantly different. The fatty acids (Table 2) found in the highest amounts in fillets were 16:0, 18:1n-9, 18:2 n-6 and 22:6n-3 (hexadecanoic acid, oleic acid, linoleic acid and DHA, respectively). The EPA (10:5n-3) was highest in fish fed the fish oil diet. The n-3:n-6 ratio varied from 3.7 to 1.6 (higher is better), while total cholesterol was not affected by dietary treatment.
Flick, Fillet proximate composition, Table 1
| Fish Oil | Canola Oil | Olein Oil | Poultry Fat | Pork Lard | |
|---|---|---|---|---|---|
| Moisture | 75% | 75% | 76% | 75% | 75% |
| Protein | 20% | 20% | 19% | 20% | 20% |
| Lipid | 2.8% | 3.1% | 3.2% | 3% | 3% |
Flick, Fillet fatty acid composition, Table 2
| Pork Lard | Fish Oil | Canola Oil | Olein Oil | Poultry Fat | |
|---|---|---|---|---|---|
| Saturated fatty acids | 29.4% | 22.4% | 36.9% | 29% | 30% |
| Monounsaturated fatty acids | 33.7% | 43.1% | 32.8% | 36.6% | 38.5% |
| 20:5n-3 | 5% | 2.8% | 3% | 3% | 2.9% |
| 22:6n-3 | 19% | 13% | 14.4% | 14.4% | 13.5% |
| Polyunsaturated fatty acids | 36.7% | 34.2% | 30.2% | 34.1% | 31% |
| n-3 | 28.8% | 21% | 20.6% | 20.8% | 19.5% |
| n-6 | 7.9% | 13.2% | 9.6% | 13.4% | 11.5% |
| n-3/n-6 | 3.7% | 1.6% | 2.2% | 1.6% | 1.7% |
| Cholesterol | 107.1 | 110.2 | 98.4 | 100.9 | 107.9 |
A sensory analysis of flavor, color, odor and texture did not show any significant differences among the cooked fillets with respect to dietary treatments, while in uncooked products, some significant differences were observed. Fish fed the C.O. and O.O. diets had the lowest total scores. The study showed that lipid source can considerably affect some aspects of the final quality of trout.
A feeding study with rainbow trout (Oncorhynchus mykiss) comparing feeds that contained a mixture of canola and linseed oils and varying amounts of canola meal with a fishmeal-fish oil diet was conducted for 140 days. Trout receiving the fishmeal-fish oil diet contained the highest concentration of saturated fatty acids (about 45 percent of total fatty acids) as compared to 11.1 to 14.6 percent for the feeds containing canola. Total monounsaturated fatty acids (MUFAs) and PUFAs increased significantly with the canola. The control diet contained 25 percent MUFAs, while the canola diets ranged from 43 to 45 percent. Total PUFAs increased from 30 percent for the control to 44 percent for the canola diets.
Chinook salmon (Oncorhynchus tshawytscha) were fed diets containing anchovy oil and poultry fat, and 25 percent, 49 percent and 72 percent (CO72) canola oil over 30 weeks. The proximate compositions of the fillets were not statistically different, and the whole body fatty acid compositions mirrored those of the diet treatments (Table 3). The relatively unsaturated canola oil resulted in a greater concentration of unsaturated fatty acids, both MUFAs and PUFAs, and a decrease in saturated fatty acids in the tissue. The EPA levels significantly decreased with increasing unsaturated fatty acids in the diet, while DHA significantly increased only with the CO72 feed.
Flick, Fillet fatty acid composition, Table 3
| Anchovy Oil/Poultry Fat | 25% Canola Oil | 45% Canola Oil | 72% Canola Oil | |
|---|---|---|---|---|
| Saturated fatty acids | 25.2 | 21.9 | 19 | 14.2 |
| Monounsaturated fatty acids | 45.1 | 47.3 | 50.7 | 56.7 |
| 20:5n-3 | 3 | 2.4 | 1.8 | 1 |
| 22:6n-3 | 10.2 | 9.4 | 8.4 | 5.8 |
| Polyunsaturated fatty acids | 29.6 | 30.8 | 30.3 | 29.1 |
| n-3 | 16.3 | 15.5 | 14 | 11.1 |
| n-6 | 13.3 | 15.3 | 16.3 | 18 |
| n-3/n-6 | 1.2 | 1 | 0.9 | 0.6 |
A similar study on feeding gilthead sea bream (Sparus aurata) with vegetable oils (rapeseed oil, linseed oil, soybean oil) resulted in reduced fillet EPA. Moreover, refeeding with an anchovy fish oil diet for 90 days did not result in the recovery of EPA concentrations in the fillets. It was also noted that soybean oil inclusion in the diet produced fillets that were significantly less shiny and less hard, but more juicy and more adhesive than fillets from fish fed the fish oil diet.
A 20-week feeding trial was conducted to determine the effects of using three palm oil products as the principal dietary lipid for red hybrid tilapia Oreochromis species. The diets were formulated with fish oil, crude palm oil, palm fatty acid distillate and refined, bleached and deodorized palm oil. There was no significant difference in the proximate composition of fillets from fish fed the various diets.
The deposition of fatty acids in the fish tissues (Table 4) was generally influenced by the fatty acid profiles of the diets. Fatty acid profiles of tilapia fed palm oil-based diets had significantly higher concentrations of saturated and monounsaturated fatty acids, but lower levels of polyunsaturated fatty acids than fish fed a diet with fish oil. Fillets of fish fed the diet with fish oil had significantly higher concentrations of EPA and DHA compared with fish fed palm oil-based diets.
Flick, Fillet fatty acid composition, Table 4
| Fish Oil | Crude Palm Oil | Palm Fatty Acid Distillate | Refined Palm Oil | |
|---|---|---|---|---|
| Saturated fatty acids | 20.9% | 41.2% | 44.2% | 38.6% |
| Monounsaturated fatty acids | 40.2% | 35.7% | 33.6% | 38.4% |
| 20:5n-3 | 5.5% | 1.6% | 1.6% | 1.7% |
| 22:6n-3 | 12% | 6.1% | 3.6% | 3.3% |
| Polyunsaturated fatty acids | ||||
| n-3 | 23.4% | 3% | 6.5% | 6.4% |
| n-6 | 8.3% | 13.3% | 11.6% | 13.4% |
| n-3/n-6 | 2.8% | 0.5% | 0.6% | 0.5% |
Feed effects: lipid oxidation
There is an increasing trend to raise the lipid content in some fish feeds to improve feed-conversion ratios and increase the lipid concentrations in the fish muscle. However, one disadvantage of the higher lipid concentration in fish is the potential for increased rates of oxidation, which could affect fish health and contribute to off-flavors in the fillets.
In research, rainbow trout were fed 15 or 30 g lipid/100 g feed and 300 or 1,500 mg vitamin E. Lipid concentrations in the fillets reflected the dietary lipid concentrations. Increasing the lipid concentration in the feed from 15 percent to 30 percent increased the fillet lipid concentration from 8.4 to 9.6 g lipid/100 g filet. The vitamin E concentrations in the fillets also reflected dietary concentrations and ranged from 8.3 to 49.1 mg/kg.
Fish fed the 30 percent lipid diets had significantly higher concentrations of malonaldehyde in the fillets than fish fed the 15 percent lipid diets, which reflected greater lipid oxidation. Fish fed the 1,500 mg vitamin E diets had significantly lower concentrations of malonaldehyde in the fillets than fish fed the diet with less vitamin E.
Principal components analysis of sensory evaluation results showed that fish fed the diets containing the lower vitamin E concentrations had higher scores than other treatments on a “fishiness” axis, which was highly correlated with overall flavor intensity. The results suggested that fish can be fed elevated lipid levels if appropriate concentrations of vitamin E are included in the feed.
(Editor’s Note: This article was originally published in the November/December 2009 print edition of the Global Aquaculture Advocate.)
Now that you've reached the end of the article ...
… please consider supporting GSA’s mission to advance responsible seafood practices through education, advocacy and third-party assurances. The Advocate aims to document the evolution of responsible seafood practices and share the expansive knowledge of our vast network of contributors.
By becoming a Global Seafood Alliance member, you’re ensuring that all of the pre-competitive work we do through member benefits, resources and events can continue. Individual membership costs just $50 a year.
Not a GSA member? Join us.
Author
-

Food Science
And Technology Department
Virginia Tech/Virginia Sea Grant (0418)
Blacksburg, Virginia 24061 USA
Related Posts

Aquafeeds
Aquaculture feed composition helps define potential for water pollution
A study found that feed for salmon and trout had higher organic carbon concentrations than did catfish, shrimp and tilapia feeds. Nitrogen and phosphorus concentrations were similar among salmon, trout and shrimp feeds, and higher than those in catfish and tilapia feeds.

Aquafeeds
A look at protease enzymes in crustacean nutrition
Food digestion involves digestive enzymes to break down polymeric macromolecules and facilitate nutrient absorption. Enzyme supplementation in aquafeeds is a major alternative to improve feed quality and nutrient digestibility, gut health, compensate digestive enzymes when needed, and may also improve immune responses.
Aquafeeds
A look at phospholipids in aquafeeds
Phospholipids are the major constituents of cell membranes and are vital to the normal function of every cell and organ. The inclusion of phospholipids in aquafeeds ensures increased growth, better survival and stress resistance, and prevention of skeletal deformities of larval and juvenile stages of fish and shellfish species.
Health & Welfare
Alaska’s purple-hinge rock scallops considered for aquaculture development
Purple-hinge rock scallops are highly prized by local communities and harvested for subsistence in coastal Alaska. To evaluate the suitability of purple-hinge rock scallops for mariculture in Alaska, the authors conducted a four-year grow-out study.