Global finfish production review: Gradual growth
Global production of farmed finfish continues increasing but at slower pace
This is a summary of some of the findings from the Global Aquaculture Alliance’s (GAA) global production survey for selected finfish and mussel species. A presentation of the data collected and analyzed, co-authored by Ragnar Nystoyl, Ragnar Tveteras and Darryl Jory, was presented at the recent GOAL 2015 conference in Vancouver, Canada. The estimates are based on a global survey of many information sources undertaken by GAA, which is coordinated by Darryl Jory, and estimates from Kontali. Production figures until 2013 are significantly based on the FAO’s Fishstat database. The Norwegian Seafood Council and NMFS have provided data on prices for several species. Table 1 provides a summary of finfish production volumes, and pertinent individual species and trends are presented in the article.
Tilapia
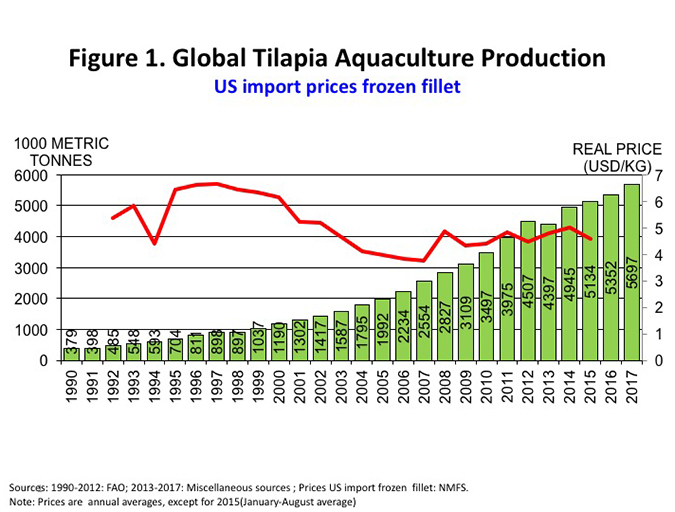
Tilapia — the most geographically and technologically diversified of all farmed species — has continued to add production over time (Figure 1). Tilapia production is expected to reach 5.1 million metric tons (MMT) in 2015, a 3.8 percent growth from 2014. Next year it is expected to grow by 4.2 percent to around 5.31 MMT. This is still significantly lower than the average growth rate from 2006 to 2015, which was 10.1 percent.
When we look at a representative price, the U.S. import price for frozen fillets, we find that real prices have been between $4-5 per kg since 2008. It increased last year to slightly above $5 per kg, and for most of 2015 it was on average $4.60 per kg. The increase in production since 2008 has not lead to lower market prices, indicating that the demand for tilapia has also shifted with supply.
China is the leading global producer of tilapia, followed by Indonesia and Egypt. It may not be surprising that our sources do not agree on the production levels of the major producing countries. For 2015, the production range for China is between 1.5 and 1.8 MMT, and the same is expected for 2016. In 2015, the average estimate of our sources is 1.6 MMT for China, 940,000 metric tons (MT) for Indonesia and 625,000 MT for Egypt. Production is expected to increase next year for all these countries.
Pangasius
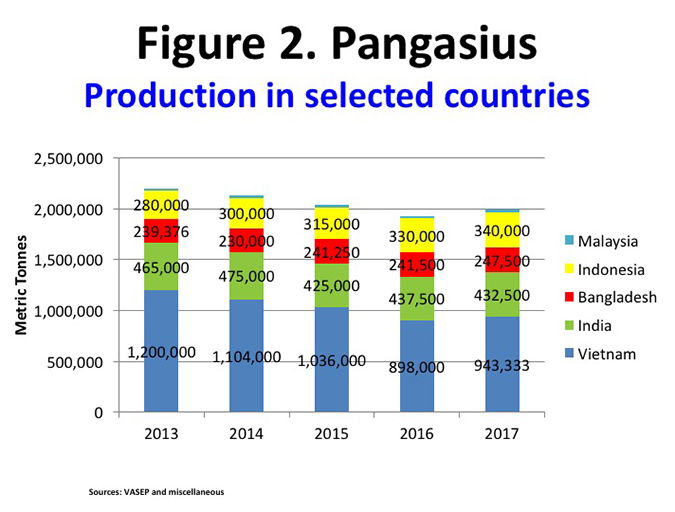
Pangasius is not only a species with a broad market base globally. Production is also continuing to diversify geographically, as seen in Figure 2. The stagnation of Vietnam’s production means that its share of production is below 50 percent now. The total production from those countries reporting is around 2 MMT in 2015, a drop from 2.1 MMT in 2011. Production is predicted to go further down in 2015 to 1.9 MMT.

With Pangasius there also are discrepancies between our sources. For example, the range for 2015 is from 900,000 MT to 1.2 MMT. When we take the averages of our sources, Vietnam is estimated to experience a drop in production from 1.1 mmt in 2014 to 1.0 MMT in 2015. And production is expected to continue its decline in 2016, down to around 900,000 MT. Declining prices since 2011 is one part of this story, but since 2013 the US and EU import prices have been fairly stable, around US$3 per kg in the United States and about $2.5 per kg in the EU.
Catfish
Obtaining reliable data on farmed catfish production is still challenging. Vietnam, China, India, Indonesia and Bangladesh are among the largest producers. Total production in those countries we monitor reached levels of 3.7 MMT in 2015, around the same level as the previous year. The US import price of frozen catfish fillet has increased from the low level of $US4 per kg in 2013 to $6 per kg in 2015. Production is expected to remain at roughly the same level next year.
Salmonids
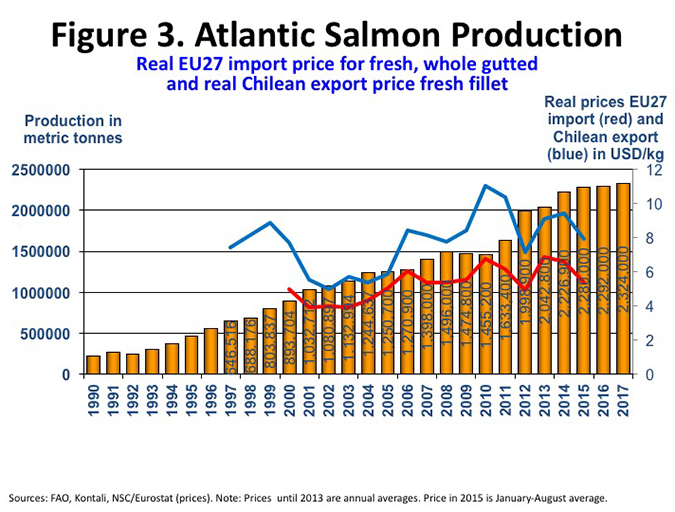
Atlantic salmon is expected to reach a production of 2.23 MMT this year, as shown in Figure 3, up by 2.5 percent from 2014, prices fell from 2014 to 2015 to around $8 per kg for Chilean fillets exported and around $5 per kg for whole gutted salmon into the EU. These prices still provide good margins for efficient salmon producers. Next year production is expected to be around the same level as in 2015.
Coho production is bouncing back to an expected level of 162,000 MT in 2015, as shown in Table 1, but production is expected to decline by 7 percent again next year. The increase in production this year has been accompanied by a decrease in the export price of Chilean Coho frozen, from $5.7 to $4.9 per kg.
Rainbow trout farmed in marine waters is still on a path of decline from the peak 2012 levels. It is expected to decline by 10 percent in 2015 to 257,000 MT. Next year production is predicted to decline slightly, to 250,000 MT. Prices are not helping rainbow trout production, as the prices have declined from peak levels of $7 per kg to levels between $4-5 per kg in 2015.
Global production of farmed finfish continues to increase but at slower pace than in recent years, and the annual growth rates need to increase to at least 7.2 percent if we are to keep pace with the double-in-a-decade objective.
We also collected data on other diadromous species — small trout, barramundi and milkfish — and their production figures are shown in Table 1. The smaller trout, primarily farmed in freshwater, is still on a slight upward trend. Production is increasing by 5 percent to around 600,000 MT in 2015. Production in 2016 is expected to increase further, by 7 percent to 640,000 MT.
| Species, region | Production in 1,000 MT 2013 | Production in 1,000 MT 2014 | Production in 1,000 MT 2015 | Production in 1,000 MT 2015 | Production growth % 2013-2014 | Production growth % 2014-2015 | Production growth % 2015-2015 | Production growth % Avg. 2006-2015 |
|---|---|---|---|---|---|---|---|---|
| Atlantic salmon | 2,043 | 2,227 | 2,280 | 2,292 | 9.0 | 2.4 | 0.5 | 6.4 |
| Coho salmon | 180 | 134 | 162 | 151 | -25.6 | 21.1 | -7.0 | 4.3 |
| Large rainbow trout | 302 | 285 | 257 | 253 | -5.6 | -9.8 | -1.6 | 1.4 |
| Small trout | 585 | 574 | 603 | 644 | -1.8 | 5.0 | 6.8 | 5.7 |
| Milkfish: Philippines & Taiwan | 467 | 455 | 467 | 473 | -2.5 | 2.6 | 1.4 | 3.4 |
| Barramundi | 81 | 87 | 94 | 102 | 7.9 | 7.9 | 7.8 | 12.0 |
| Carp, selected countries | 21,844 | 23,113 | 24,625 | 26,053 | 5.8 | 6.5 | 5.8 | 6.0 |
| Tilapia | 4,397 | 4,945 | 5,134 | 5,352 | 12.4 | 3.8 | 4.2 | 10.1 |
| Catfishes, selected countries | 2,577 | 2,672 | 2,678 | 2,837 | 3.7 | 0.2 | 5.9 | 11.2 |
| Pangasius, Vietnam | 1,150 | 1,104 | 1,036 | 898 | -4.0 | -6.2 | -13.3 | 13.3 |
| Sea bass & bream, Mediterranean | 320 | 327 | 309 | 301 | 2.2 | -5.4 | -2.5 | 6.1 |
| Grouper, selected countries | 47 | 49 | 50 | 53 | 4.7 | 3.3 | 6.2 | 8.6 |
| Olive flounder, Korea Rep. | 37 | 42 | 25 | 25 | 14.0 | -39.5 | — | -2.7 |
| Bluefin tuna | 31 | 36 | 39 | 39 | 17.1 | 6.6 | — | 2.2 |
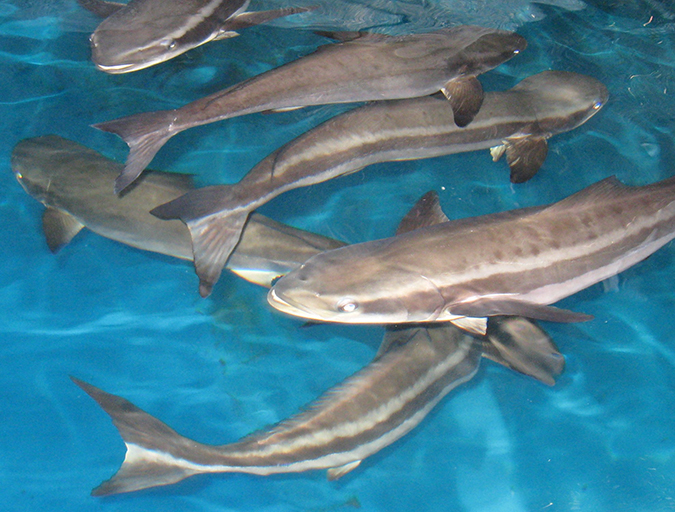
| Cobia, selected countries | 43 | 45 | 49 | 52 | 6.2 | 7.2 | 7.5 | 10.0 |
| Turbot, excluding China | 9 | 9 | 11 | 11 | 7.5 | 21.6 | -5.8 | 9.7 |
| Atlantic halibut | 2 | 1 | 2 | 2 | -5.3 | 19.7 | 0 | 4.0 |
| Atlantic cod | 8 | 4 | 5 | 5 | -54.5 | 48.6 | -3.8 | 1.2 |
Marine fish species
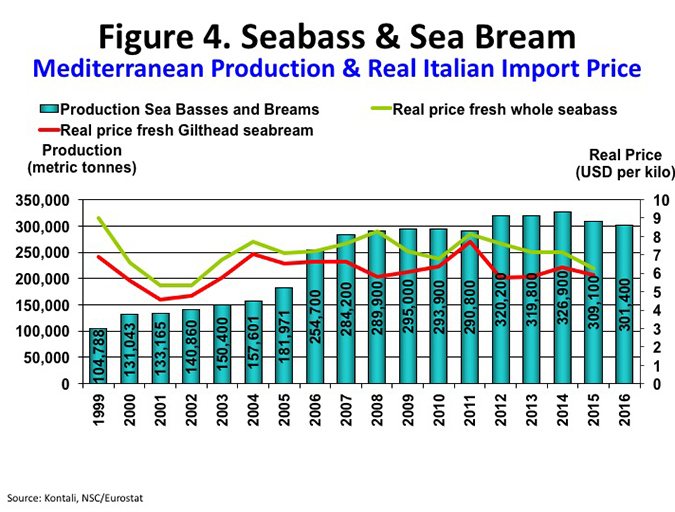
Seabass and sea bream production in the Mediterranean is expected to decline in 2015 by 5 percent to around 300,000 MT (Figure 4). Production next year is expected to remain at the same level. Prices have not provided much incentive to growth, as they have been more or less stable since 2004, and have been declining from 2011 levels; prices in 2015 were around $6 per kg. Production volumes and growth rates for other marine fish species covered by our survey — such as Atlantic halibut and cod, turbot, cobia and Bluefin tuna — are included in Table 1.
Total production including carps
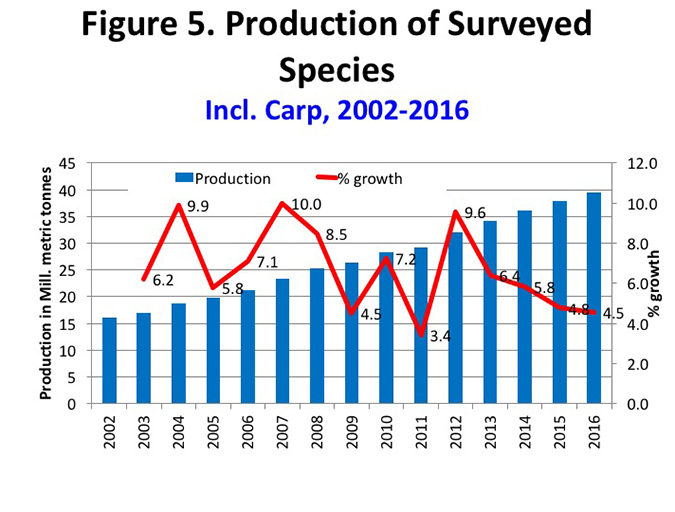
Figure 5 presents the total production of species and countries covered by our surveys. In 2013, our surveyed sectors covered 34 MMT of the total 47 MMT produced according to FAO. Our data show that production has increased from 16 MMT in 2002 to an expected level of almost 40 MMT in 2016. What about growth rates? Doubling in a decade requires 7.2 percent annual growth. We added percentage growth rates implied by these production figures, and all are on the positive side. In 2013, growth was as high as 9.6 percent, but was then on a path of decline to 6.4 percent in 2014, 5.8 percent in 2015 and an expected 4.5 percent in 2016.
Total production excluding carps
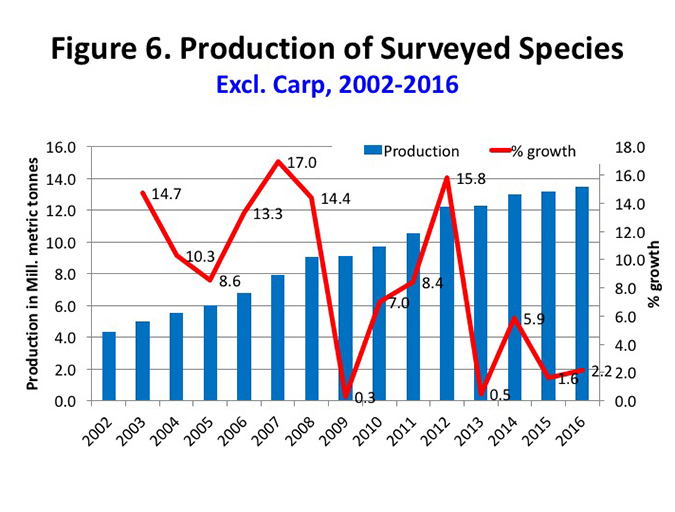
Per Figure 6, in 2013 our survey of the remaining fish species covered 12 MMT of the 47 MMT produced globally. Production of these species has increased from 4.4 MMT in 2002 to 13 MMT in 2015. When we include growth rates, we can see a volatile growth pattern. There are a number of years with growth rates above 7.2 percent, which is the rate necessary to achieve doubling in a decade. From the low of the financial crisis around 2009 we saw a great recovery of growth rates to 16 percent in 2012. But from there it was downhill in the sense that growth rates have been much lower. In 2013, growth was around zero according to our figures. In 2014 it was 6 percent, in 2015 it is expected to be 1.6 percent, and in 2016 we expect it to reach around 2 percent.
Double in a decade?
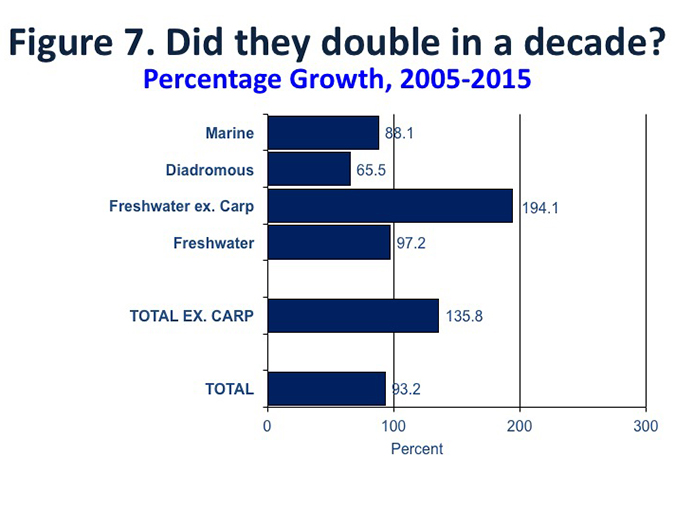
Do the species covered by our survey doubled production in a decade? Figure 7 presents a mixed picture. Marine species were not able to double their production, with a growth of 88 percent from 2005 to 2015. Diadromous species increased by 66 percent. Freshwater species increased by 194 percent when we exclude carps. In other words, its production was almost three times higher in 2015 compared to 2005. If we include carps, the freshwater sectors roughly doubled their production. What about the total? When we include carps it is close to a doubling, with a 93 percent growth. When we exclude carps we see a more impressive total development, a growth of 135 percent.
Perspectives
So, until 2015 it appears that our finfish production sectors have been able to double their production in a 10-year perspective. But it must be noted that most of the growth happened in the first half of this 10-year period. Our conclusion is that global production of farmed finfish continues to increase but at slower pace than in recent years, and the annual growth rates need to increase to at least 7.2 percent if we are to keep pace with the double in a decade objective.
Author
-

The University of Stavanger
4036 Stavanger, Norway
Related Posts
Health & Welfare
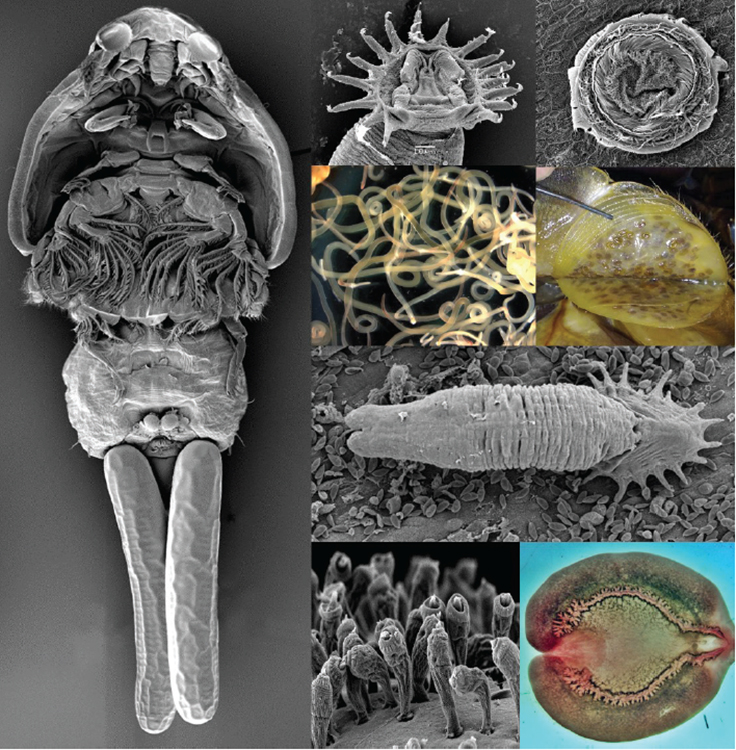
Economic impacts of aquatic parasites on global finfish production
Obligate and opportunistic parasites play a critical role in determining the productivity, sustainability and economic viability of global finfish aquaculture enterprises. Without stringent and appropriate control measures, the impacts of these pathogens can often be significant.
Intelligence
Global Farmed Finfish Production Outlook: Slower-paced growth
The GOAL 2016 survey for global production of farmed fish shows that most major finfish groups increased their farmed production in 2015. The total production of species and countries covered by the survey is forecasted to reach 42 MMT in 2016.
Innovation & Investment
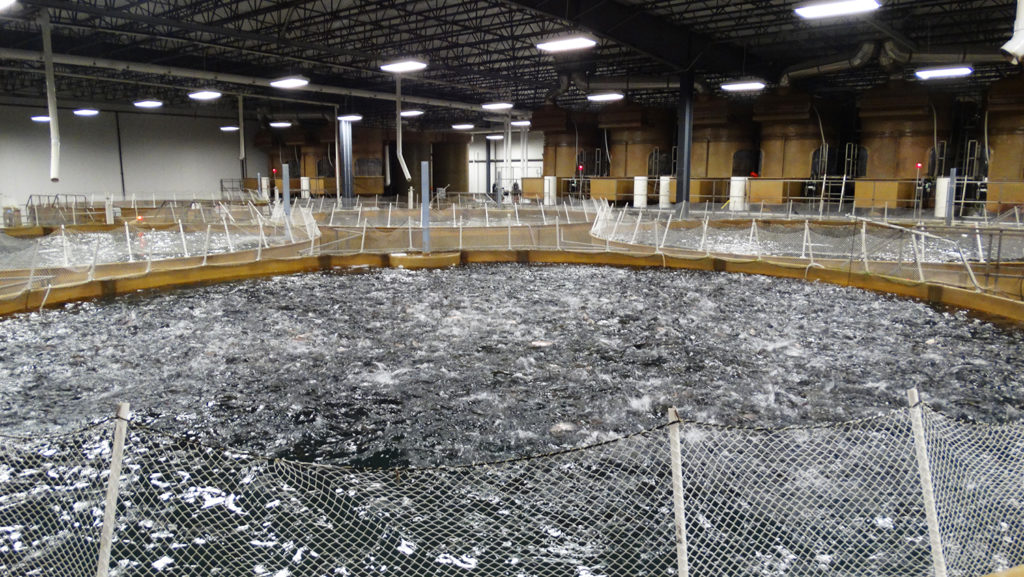
AquaBounty, with new RAS facility, hopes to win public support for GM salmon
Ron Stotish, CEO of AquaBounty Technologies, believes genetically modified salmon is no threat to its opponents and the outlook for AquAdvantage is good. With its purchase of the Bell Fish Co. RAS facility, commercialization will soon commence.
Responsibility
Assessing culture potential of red emperor snapper in New Caledonia
The red emperor snapper, known as “pouatte” in New Caledonia, is valuable throughout its broad geographic range and a highly valued food fish locally. Declining wild catches and market demand have provided the incentive to carry out technical feasibility studies to determine its commercial aquaculture potential.