Omega-3 feed enrichment improves consumer acceptance of shrimp tails
Krill oil-fed shrimp obtained the highest score for flavor
The sensory and qualitative attributes of food products influence consumers’ willingness to buy and at times override the factor of price. Obviously, purchasing choices also result from the interaction of many other determinants, including packaging, branding, marketing strategies, and cultural and socioeconomic background.
Nowadays, intensive research continues to improve the shelf life, final characteristics and composition of animal products through feeding. For aquaculture species, enrichment of products with omega-3 fatty acids and color enhancement are typical objectives that affect product differentiation and related consumer purchasing choices.
The authors carried out a study to evaluate the effects of three dietary lipid sources on Litopenaeus vannamei tail composition and consumers’ level of acceptance of the white shrimp product.
Shrimp culture
Juvenile shrimp of 11.4 ± 2.0 grams weight were reared for nine weeks in 500-L experimental clearwater tanks and fed one of four diets. The diets were similar in nutritive levels except their essential fatty acid (EFA) profiles, which varied as a result of the main oil sources used and their inclusion levels in the diets.
Two diets with fish oil and krill oil were formulated to meet the EFA requirements (Table 1). A diet containing soybean oil was underformulated for the highly unsaturated fatty acids (HUFAs) eicosapentaenoic acid and docosahexaenoic acid. Another diet was formulated to allow a higher inclusion of krill oil restricted only by a maximum final diet lipid level of 9.5 percent.
Nunes, Main lipid sources, Table 1
| Chemical Composition | Fish Oil | Soybean Oil | Krill Oil | Krill Oil |
|---|---|---|---|---|
| Nutritional Levels | ||||
| Crude protein (g/kg, wet basis) | 351.80 | 354.40 | 353.50 | 353.10 |
| Crude fiber (g/kg, wet basis) | 12.00 | 9.00 | 13.30 | 12.00 |
| Ash (g/kg, wet basis) | 93.70 | 89.50 | 91.00 | 82.30 |
| Inclusion of Lipid Sources | ||||
| Fish oil (g/kg, wet basis) | 266.00 | 0 | 0 | 0 |
| Krill oil (g/kg, wet basis) | 0 | 0 | 483.00 | 550.00 |
| Soybean oil (g/kg, wet basis) | 100.00 | 345.00 | 44.00 | 38.00 |
| Cholesterol (g/kg, wet basis) | 0 | 13.00 | 0 | 4.00 |
| Soybean lecithin (g/kg, wet basis) | 150.00 | 150.00 | 0 | 0 |
| Marine oil:plant oil ratio | 2.70 | 0 | 11.00 | 14.40 |
| Nutrient Levels | ||||
| Total lipid content (g/kg, wet basis) | 88.80 | 94.00 | 80.80 | 91.30 |
| DHA (% total lipid content) | 2.54 | 0.28 | 1.60 | 1.37 |
| EPA (% total lipid content) | 5.10 | 0.65 | 5.35 | 5.07 |
| HUFAs (% total lipids) | 7.64 | 0.93 | 6.94 | 6.44 |
| LOA (% total lipids) | 28.32 | 44.71 | 16.21 | 17.97 |
| LNA (% total lipids) | 3.40 | 4.91 | 1.52 | 2.03 |
| EFAs (% total lipids) | 39.36 | 50.54 | 24.68 | 26.44 |
| Astaxanthin (ug/100 ul) | 13.80 | 14.70 | 21.40 | 17.30 |
DHA = Docosahexaenoic acid, EPA = Eicosapentaenoic acid
LOA = Linoleic acid, LNA = Linolenic acid
Sensory trial
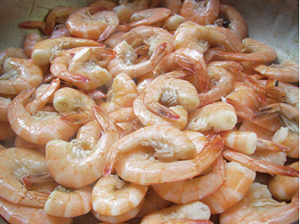
After harvest and initial processing, shell-on shrimp were defrosted, deheaded and rinsed in mineral water. In a stainless steel pan, groups of 65 shell-on tails of each dietary treatment were cooked for five minutes in boiling water with 3 grams per liter of table salt. After cooking, the shrimp were drained and stored.
Ten male and female testers were recruited to carry out the sensory trial. Prior to each evaluation, they were trained in tasting procedures and the best-worst scaling method described by Sara Jaeger and co-authors. To avoid biased responses on test variables, the shrimp were randomly identified, and the testers were instructed not to consider shrimp tail size or shape.
The sensory analysis consisted of four taste sets on shrimp color, texture and flavor.
Results
The sensory preferences were transformed into scores for each sample as well as participant. The positive choice “Most Liked” was attributed a value of +1. Negative “Least Liked” choices received -1 scores. When a sample was not chosen in the set, it received a score of zero. Each referee tasted each sample three times, so final scores from individual referees could range -3 to +3.
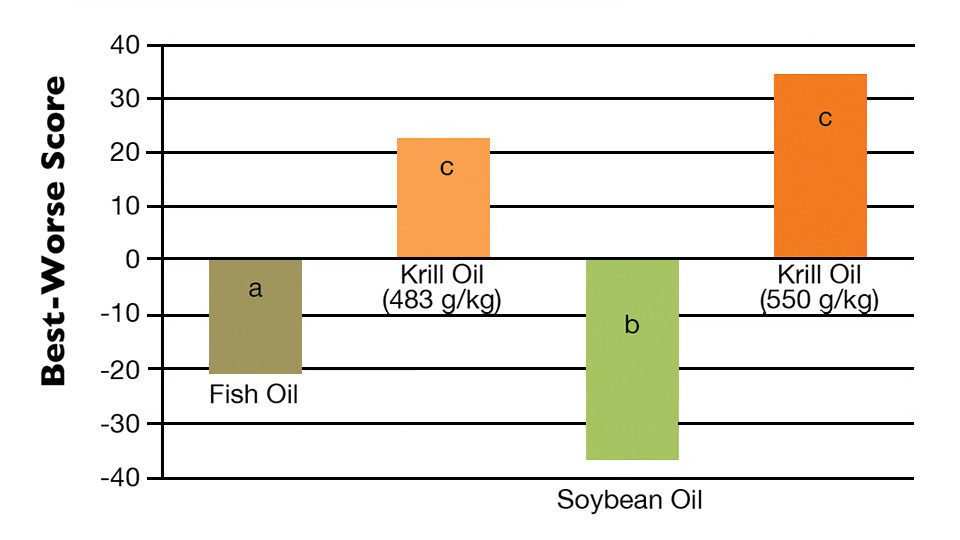
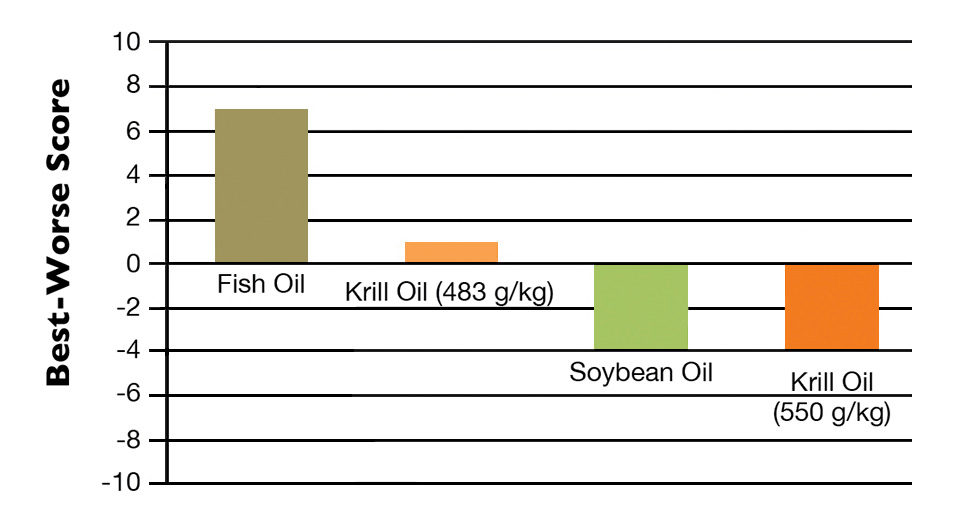
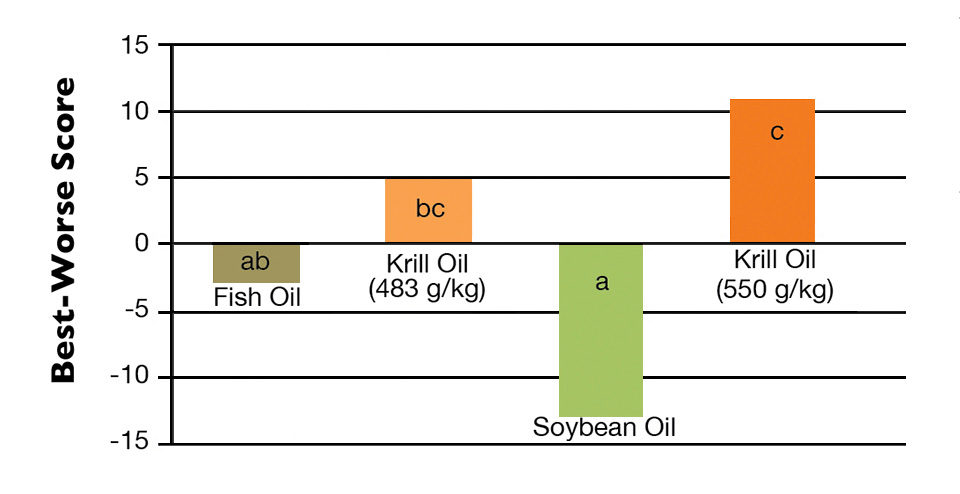
The sum of all values for each sample generated the final scores for shrimp color (Fig. 1), texture (Fig. 2) and flavor (Fig. 3). To determine if the differences in scores among the samples were statically significant, a non-parametric Mann-Whitney U test was carried out for each variable.
Shrimp color, texture, flavor
With 65 percent of all positive choices, shrimp fed the diet with the greater krill oil content received the highest final score for shrimp color, followed by the other diet with krill oil. The diet with soybean oil was chosen as worst in color in 68 percent of all tastes.
Variations in shrimp texture preference were very slight, and no significant (P > 0.05) differences were found among the tasted shrimp. As the shrimp tails were shell-on, differences resulting from variations in shrimp body weight and/or molting stage could have influenced the scoring.
Shrimp fed the diet with greater krill oil obtained the highest score for shrimp flavor. The other krill diet had results not significantly different from the fish fed feed with fish oil. Despite this, shrimp fed the diet with fish oil were negatively chosen almost two-fold more often than the shrimp fed krill-supplemented feed. Shrimp fed the diet with soybean oil had the lowest flavor score and the highest percentage of negative choices, although it did not significantly differ from the diet with fish oil.
Shrimp tails from animals fed diets containing increased levels of HUFAs – those with added fish or krill oil – showed higher amounts of these fatty acids than shrimp fed the soy oil diet (Table 2).
Nunes, Fatty acid profiles, Table 2
| Fatty Acids | Profile (% total lipid content) Fish Oil | Profile (% total lipid content) Krill Oil (483 g/kg) | Profile (% total lipid content) Soybean Oil | Profile (% total lipid content) Krill Oil (550 g/kg) |
|---|---|---|---|---|
| Linoleic acid | 14.93 | 11.10 | 26.94 | 11.53 |
| Linolenic acid | 0.63 | 0.54 | 1.30 | 0 |
| Docosahexaenoic acid | 5.34 | 4.22 | 3.53 | 5.66 |
| Eicosapentaenoic acid | 10.09 | 11.50 | 6.60 | 13.92 |
(Editor’s Note: This article was originally published in the September/October 2009 print edition of the Global Aquaculture Advocate.)
Now that you've reached the end of the article ...
… please consider supporting GSA’s mission to advance responsible seafood practices through education, advocacy and third-party assurances. The Advocate aims to document the evolution of responsible seafood practices and share the expansive knowledge of our vast network of contributors.
By becoming a Global Seafood Alliance member, you’re ensuring that all of the pre-competitive work we do through member benefits, resources and events can continue. Individual membership costs just $50 a year.
Not a GSA member? Join us.
Authors
-

LABOMAR – Instituto de Ciências do Mar
Avenida da Abolição, 3207, Meireles
60.165-081, Fortaleza, Ceará, Brazil -
LABOMAR – Instituto de Ciências do Mar
Avenida da Abolição, 3207, Meireles
60.165-081, Fortaleza, Ceará, Brazil
Related Posts
Health & Welfare
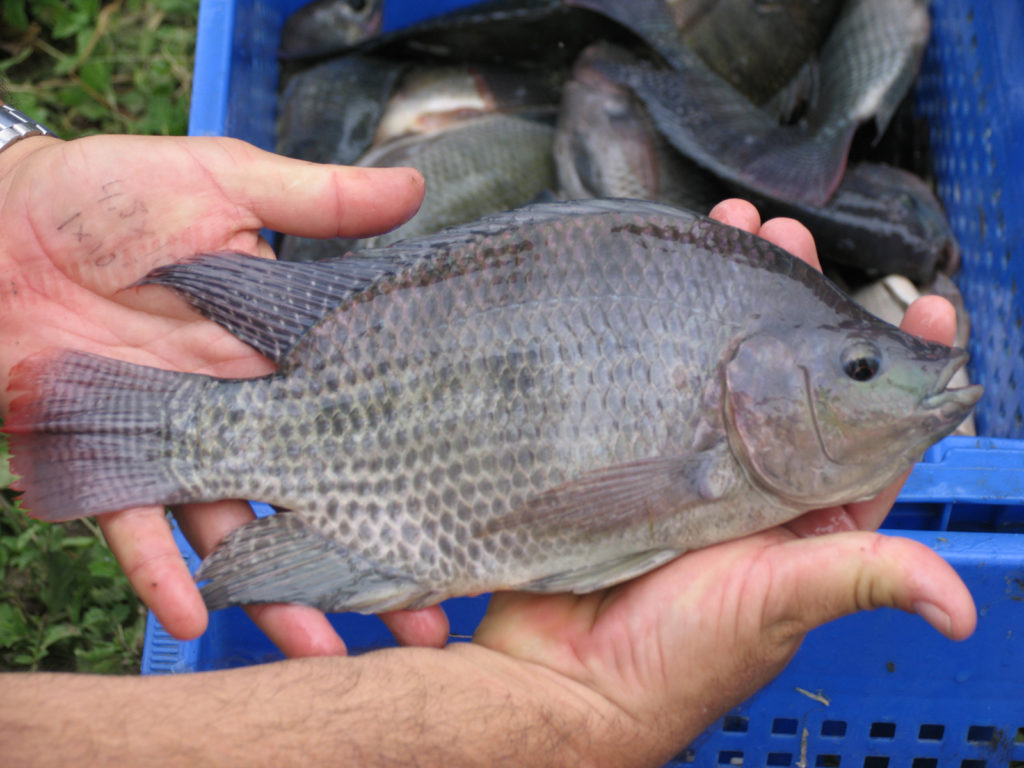
10 paths to low productivity and profitability with tilapia in sub-Saharan Africa
Tilapia culture in sub-Saharan Africa suffers from low productivity and profitability. A comprehensive management approach is needed to address the root causes.
Aquafeeds
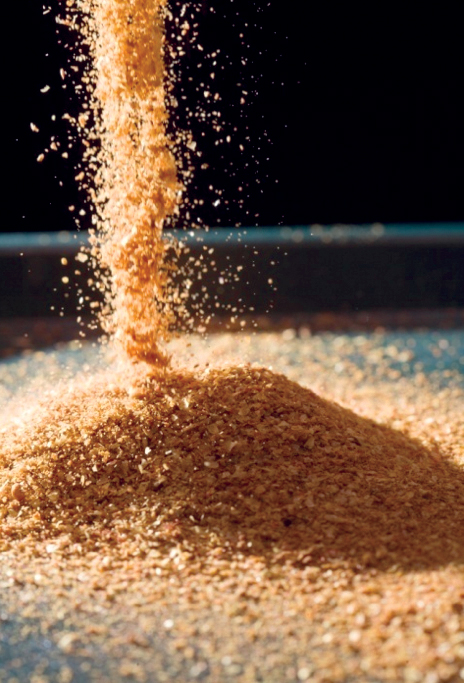
A look at corn distillers dried grains with solubles
Corn distillers dried grains with solubles are an economical source of energy, protein and digestible phosphorus to reduce feed costs and fishmeal usage.

Health & Welfare
A look at tilapia aquaculture in Ghana
Aquaculture in Ghana has overcome its historic fits and starts and is helping to narrow the gap between domestic seafood production and consumption. Production is based on Nile tilapia.
Intelligence
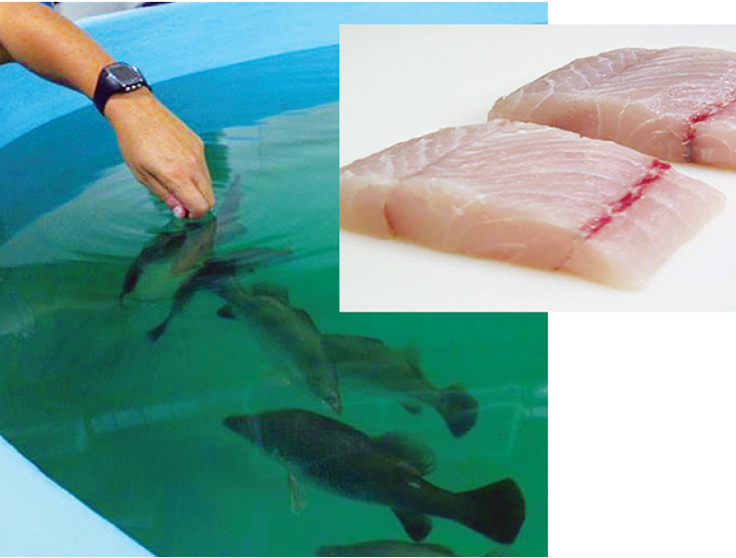
Adding flavor complexity to farmed barramundi
Organoleptic attributes such as flavor and aroma are among the most important factors that influence consumer acceptability and demand for fish products. Consumers have identified farmed fish as less complex and lacking “sealike” or “sea-fresh” flavors and aromas.