P.L. size, source strong early measures of shrimp grow-out performance
Procure from bio-secure SPF hatcheries with a track record of disease-free operation
It is widely accepted that the quality of shrimp postlarvae (P.L.) has a critical bearing on subsequent performance during grow-out at farms, but hard evidence to prove this assertion is difficult to find. The problem is compounded by a lack of agreement on how best to measure PL quality.
Limited accuracy
Most people rely on one or a combination of observations of P.L. on their behavior, morphological development, osmotic capability, nutritional condition, and absence of pathogens. Sometimes a condition or quality index is used by combining a series of individual measures of quality into a single value.
Stress tests
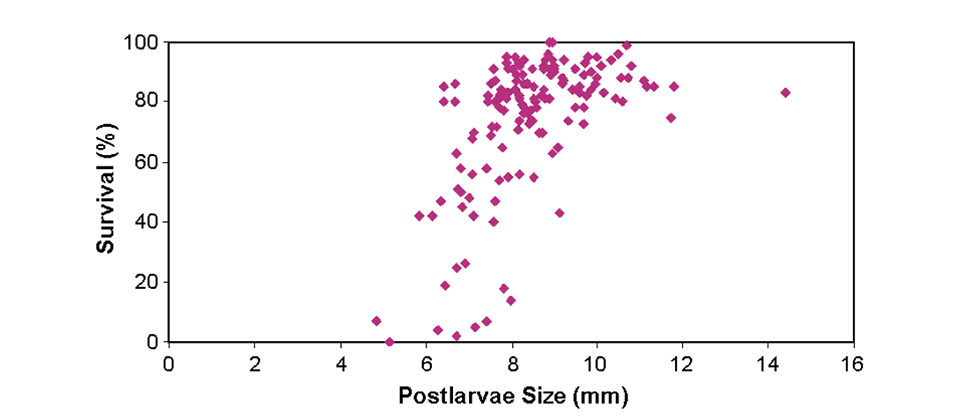
Stress tests are popular and practical tools that give information on the postlarvae’s ability to withstand osmotic, temperature, or chemical shock. However, the ability of such tests to measure innate quality is questionable because larger P.L. almost always resist better than smaller P.L. This implies that it would be simpler to just measure average PL size than to run a stress test.
Fig. 1, which illustrates the strong correlation between stress test survival and P.L. size, leads to the conclusion that Pacific white shrimp (Litopenaeus vannamei), P.L. above over 9 mm in length are “good quality” because they perform well in a salinity stress test.
Gill development
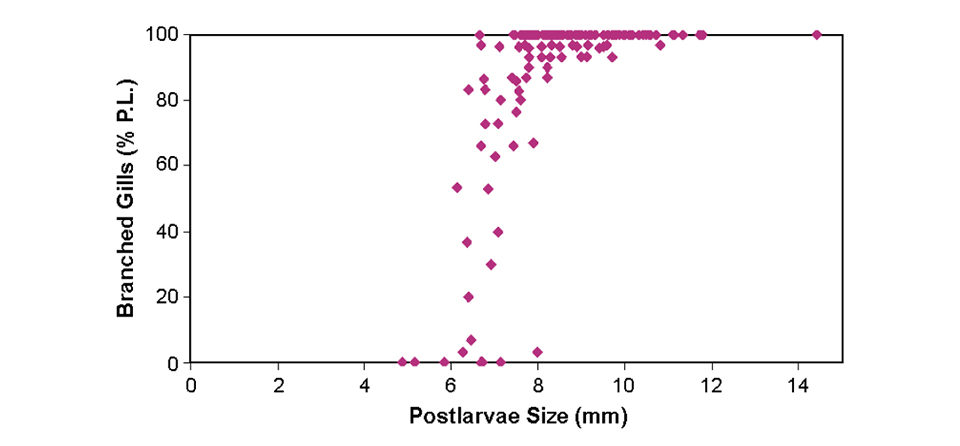
Gill development has also been touted as a useful measure of P.L. quality, but again, this characteristic is closely correlated with P.L. size. The data in Fig. 2 suggests that nearly all P.L. above 8 mm are “good quality.” Such information implies that a random sample of P.L. and a ruler might yield as much information about P.L. quality as a salinity stress test and microscopic examination of gill morphology.
Assessing P.L. quality
So how should P.L. quality be assessed? Beyond straightforward gross observations on the size, appearance and behavior of postlarvae – which all good farm managers perform before accepting a batch of P.L. – it could be that the most important aspects of P.L. quality are genetic factors and the absence of viral pathogens.
To illustrate this, Table 1 contrasts results obtained with P.L. at two very different hatcheries and times – one in Ecuador operated in 1986 and the other in the Dominican Republic operated in 2003. By far, the better results were obtained with the progeny of the selectively bred, specific-pathogen-free (SPF) Dominican Republic stock.
Lee, Linking postlarvae quality and performance, Table 1
| Hatchery Broodstock | Hatchery Disease Status | P.L. Growth Mean (mm/day) | P.L. Growth C.V. | P.L. Survival Mean | P.L. Survival C.V. | Link Between P.L. Growth, P.L. Survival | Farm Survival Mean | Farm Survival Range |
|
|---|---|---|---|---|---|---|---|---|---|
| Ecuador (1986) | Wild | IHHNV infection | 0.37 | 14% | 59% | 36% | Yes | 45% | 25-70% |
| Dominican Republic 40-90% | Domestic SPF | SPF, biosecure | 0.37 | 10% | 51% | 30% | No | 75% | 40-90% |
Although this data is somewhat disparate and would not satisfy a statistician, it does illustrate the benefits of using selectively bred SPF stock in the recent history of the shrimp-farming industry. Unfortunately, however, the majority of today’s P.L. quality tests are not designed to detect these important determinants of performance.
Only two methods of measuring P.L. quality were consistently applied at the older hatchery and the modern one: average P.L. growth rate and overall hatchery survival rate. When these numbers and accompanying coefficients of variation are compared, no major differences are apparent, so they may not contain much information about P.L. quality.
There is, however, one interesting difference between the two sets of data. In the hatchery with Infectious Hypodermal and Hematopoietic Necrosis Virus (IHHNV), P.L. growth and survival were positively correlated, but in the hatchery with SPF animals, they were not. In other words, in the hatchery with the virus problem, poor postlarvae survival was usually associated with poor growth, but in the SPF hatchery this was not the case. The presence of such a correlation could be an indicator of IHHNV infection.
Know your source
Positive genetic factors and the absence of viral pathogens clearly improve shrimp performance. With the increasing availability of SPF shrimp larvae, particularly in areas with known viral problems, it certainly makes sense to use them. To increase the likelihood of good grow-out performance, farmers should make sure the L. vannamei postlarvae they stock are sourced from a biosecure SPF hatchery with a long track record of disease-free operation, as well as stock them at 9 mm in total length or greater.
(Editor’s Note: This article was originally published in the August 2005 print edition of the Global Aquaculture Advocate.)
Now that you've reached the end of the article ...
… please consider supporting GSA’s mission to advance responsible seafood practices through education, advocacy and third-party assurances. The Advocate aims to document the evolution of responsible seafood practices and share the expansive knowledge of our vast network of contributors.
By becoming a Global Seafood Alliance member, you’re ensuring that all of the pre-competitive work we do through member benefits, resources and events can continue. Individual membership costs just $50 a year.
Not a GSA member? Join us.
Author
-

CAMS
Marine Science Laboratories
Menai Bridge, Gwynedd
LL59 5AB United Kingdom
Related Posts
Health & Welfare
Study: Inbreeding affects body weight, not survival, in white shrimp
Inbreeding commonly causes a decrease in the mean values of traits of productive interest in aquaculture. Results of a study, however, showed that inbreeding had no effect on grout survival of Pacific white shrimp from 65 to 130 days of age.
Health & Welfare
Artemia bioencapsulation delivers probiotics via digestive tracts of fish larvae
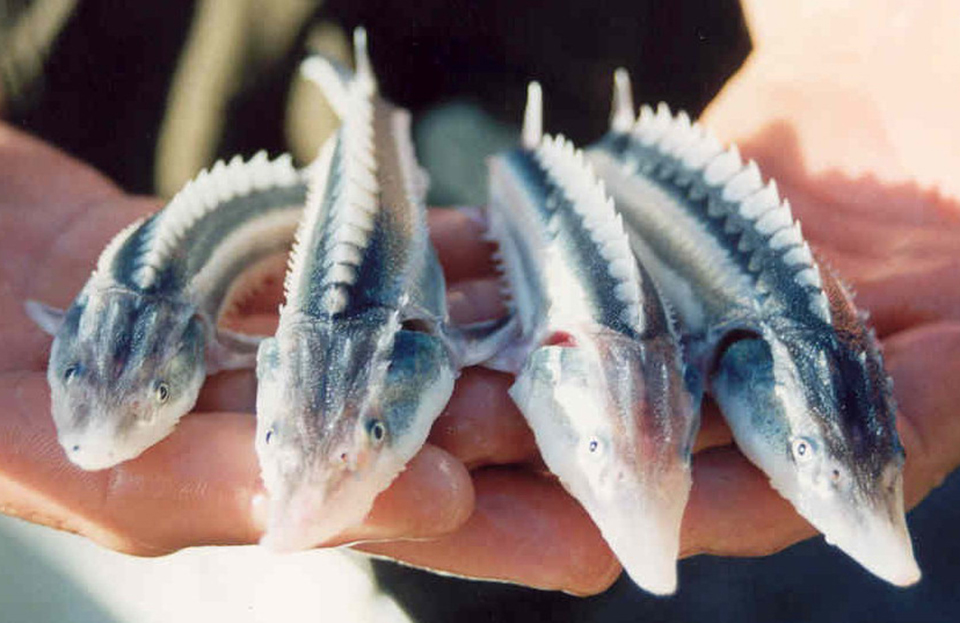
Research with sturgeon and carp species indicated that encapsulated artemia has high potential to carry probiotics or other beneficial microorganisms.
Innovation & Investment
Artemia, the ‘magic powder’ fueling a multi-billion-dollar industry
Artemia, microscopic brine shrimp used as feed in hatcheries, are the unsung heroes of aquaculture. Experts say artemia is still inspiring innovation more than 50 years after initial commercialization. These creatures are much more than Sea-Monkeys.
Innovation & Investment
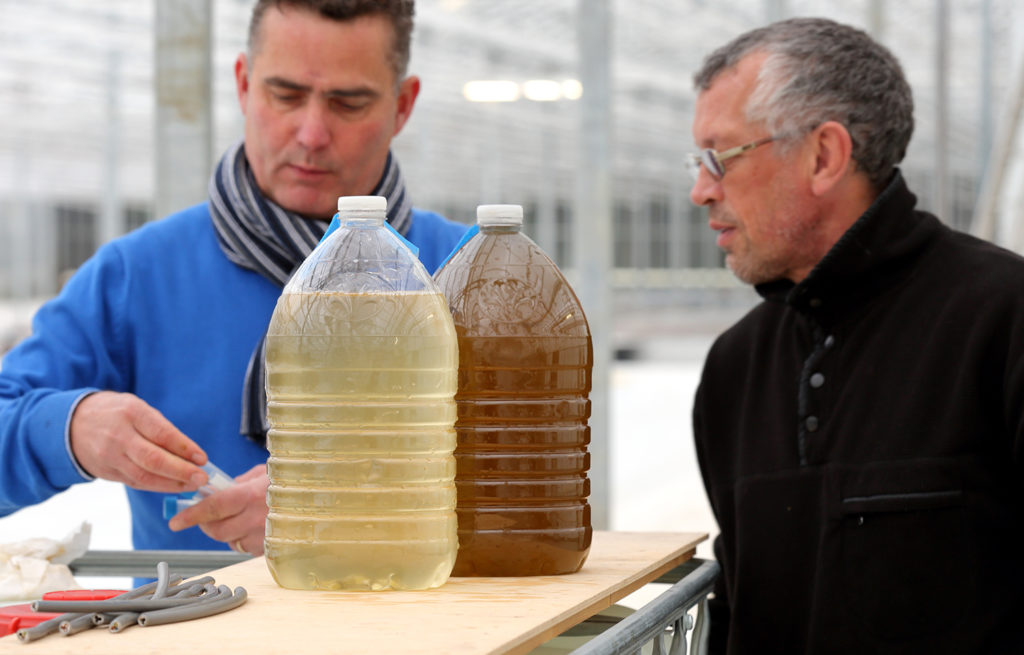
Algae innovators aim to freeze out early-stage shrimp losses
A greenhouse in Belgium believes its innovative shrimp feed product, made from freeze-dried microalgae, packs the necessary nutrients for the crustacean’s most vulnerable life stage: the first three days of its life.