Pond bottom soil analyses
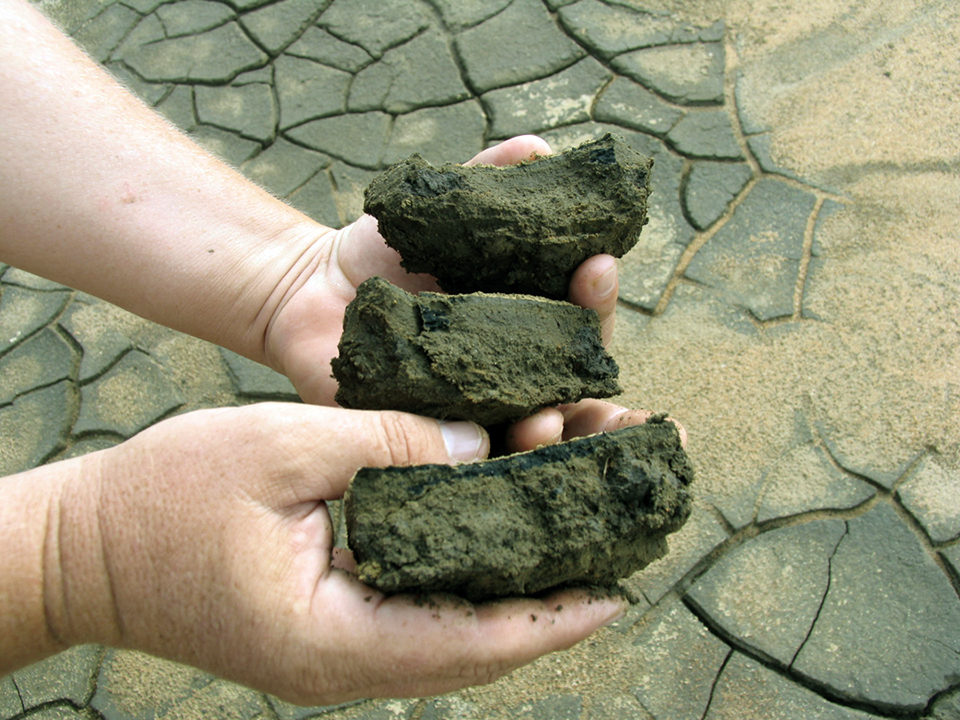
The best soil for pond construction has a loam or clay texture
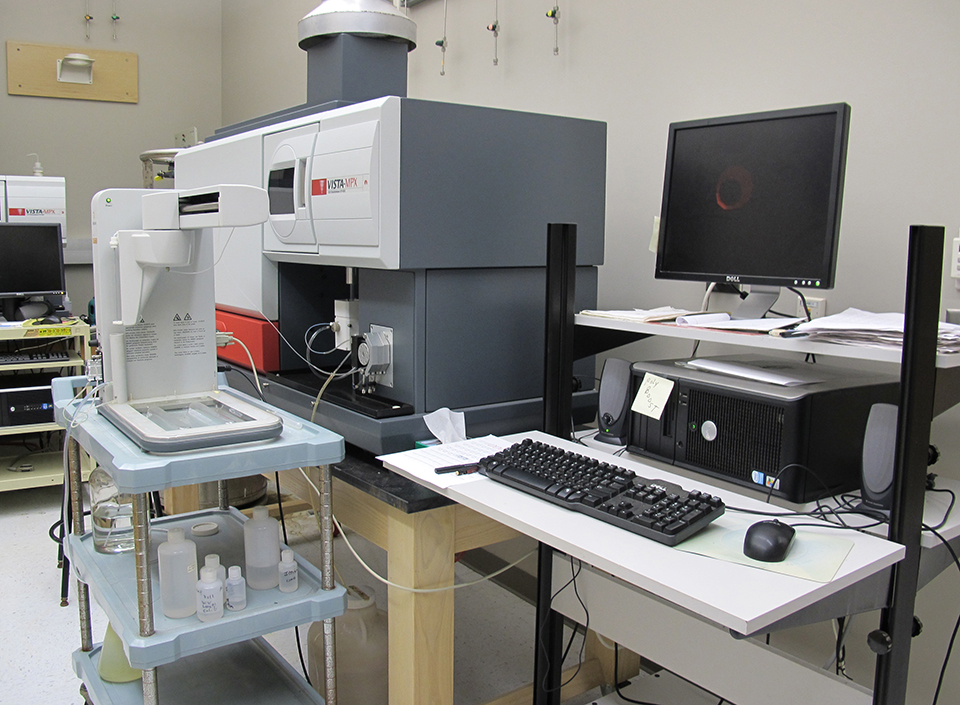
Aquaculturists sometimes send samples of pond bottom soil to laboratories for physical and chemical analyses. Many variables can be measured easily in the laboratory, but the interpretation of results for use in aquaculture is more difficult.
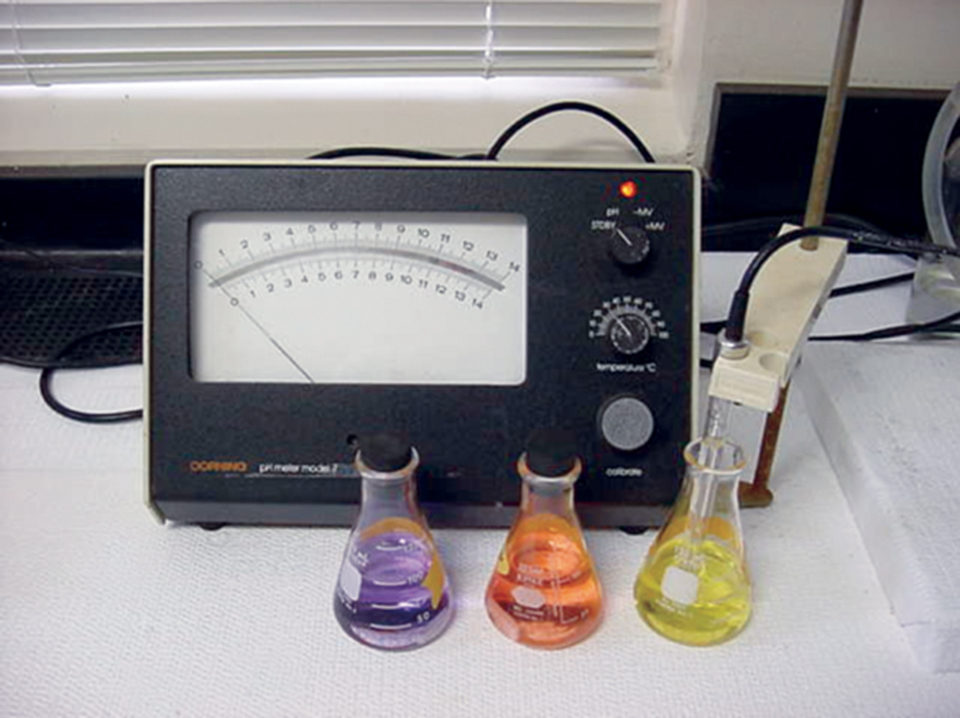
Soil pH
There are many ways of measuring soil pH, but for aquaculture ponds, it should be measured in a 1:1 slurry of distilled water and dry pulverized soil using a pH meter and glass electrode. Soil pH testers are not as accurate as pH meters.
The ideal pH is 7.5 to 8.5. Pond soils with pH below 7.5 should be limed with the amount of liming material applied based on either the results of a lime requirement test or soil pH. Most laboratories do not measure lime requirement, but liming rates can be estimated from soil pH (Table 1). There is no effective way of reducing pH in pond soils.
Boyd, Approximate liming rates of bottom soils, Table 1
| Soil pH | Liming Rate (Calcium carbonate equivalent, kg/ha) |
|---|---|
| 5.0-5.5 | 2,500 |
| 5.6-6.0 | 2,000 |
| 6.1-6.5 | 1,500 |
| 6.6-7.0 | 1,000 |
| 7.1-7.5 | 500 |
| Over 7.5 | 0 |
Pond aquaculture can be conducted in soils of a wide texture range. The best soil for pond construction has a loam or clay texture. However, clay soils dry slowly between crops, and tilling of such soils is more difficult than for lighter-textured soils. Ponds built in sandy soils usually seep badly.
Organic matter
The organic matter concentration in pond soil often is measured by the Walkley-Black sulfuric acid-potassium dichromate method. Results usually are given as percentage organic carbon. Suggestions for interpreting soil organic carbon concentrations are provided in Table 2.
Boyd, Interpretation of soil organic carbon concentration data, Table 2
| Organic Carbon (%) | Comment |
|---|---|
| 0-0.50 | Very low, will not support good growth of benthos |
| 0.51-1.00 | Low for fertilized ponds, but excellent for ponds with feeding |
| 1.01-2.50 | Optimum for fertilized ponds and acceptable for ponds with feeding |
| Over 2.50 | Excessive, prone to anaerobic zones in bottom |
Fresh organic matter that settles to the bottom during a crop decomposes much faster than older, partially decomposed soil organic matter from previous crops. However, overfeeding and improper feed distribution can result in the accumulation of uneaten feed, causing zones of impaired soil quality.
Ponds with low or moderate soil organic matter concentrations, high feeding rates and dense phytoplankton blooms can develop poor conditions at the soil-water interface because of sedimentation of dead plankton. Maintaining desirable organic carbon concentrations in pond bottoms is beneficial, but it does not avoid zones with anaerobic conditions in the bottoms of ponds with bad feed management.
Phosphorus
Soil phosphorus can be extracted with several extractants, but dilute or moderate-strength sulfuric acid and hydrochloric acid are common extractants. Acid-extractable phosphorus can range 1 to 1,000 ppm.
Phosphorus is tightly bound in soil, and fertilization generally is necessary to promote phytoplankton growth regardless of acid-extractable phosphorus concentration. In ponds with feeding, phosphorus continually enters the water from uneaten feed and excrement. The difficulty in accurately predicting phytoplankton productivity or the production of culture species from pond soil phosphorus concentrations makes it difficult to justify bottom soil phosphorus analyses.
Nitrogen
Most of the nitrogen in bottom soils is contained in organic matter. Bacteria mineralize organic matter to ammonia that can be used by phytoplankton. In fertilized ponds, nitrogen mineralization may lessen the need for nitrogen fertilization. Soil nitrogen concentration, however, does not need to be measured, for bottom soils with 1 percent soil organic carbon or more (Table 1) do not require as much nitrogen fertilization as ponds with less organic carbon.
In ponds with feeding, input of feed nitrogen overshadows the input of this nutrient from microbial degradation of soil organic matter. The most compelling reason for determining total nitrogen concentration in ponds with feeding is for the calculation of carbon:nitrogen (C:N) ratio.
The ideal C:N ratio is probably 8.1 to 12:1. Ponds with high concentrations of fresh organic matter have lower ratios and tend to develop anaerobic zones at the sediment-water interface. Higher C:N ratios suggest that pond bottoms are accumulating stable organic matter that decomposes at a slow rate. This phenomenon usually is found in ponds with low natural productivity.
Sulphur
A high concentration of total sulfur indicates that pond soil contains iron pyrite, which oxidizes to create excessive acidity. Soils with more than 0.75 percent sulfur are considered potential acid-sulfate (PAS) soils.
Pond soils should be initially analyzed for total sulfur to determine if they are PAS soils. No further sulfur analyses are needed in ponds without PAS soils.
The liming rates in Table 1 are not suitable for PAS soils. The pH usually is below 5 in PAS soil, and much higher liming rates are necessary.
Major cations
Major exchangeable cations include sodium, potassium, calcium and magnesium. These ions are adsorbed on negative charges in clay particles and finely divided organic matter in soils. They can exchange with other cations in the surrounding water and are potentially available to plants.
Current knowledge of the relationships among pond soil chemistry, water quality and aquacultural production is inadequate to permit interpretation of routine analyses of exchangeable cations.
Cation exchange capacity
Cation exchange capacity (CEC) is a measure of the quantity of cations that soil can attract. It was traditionally reported in milliequivalents (meq)/100 grams of dry soil, but today many laboratories report CEC in centimoles of charge (cmolc)/kg, which gives the same value as the older unit.
Soils range in CEC from less than 1 meq/100 grams to more than 50 meq/100 grams. Factors that influence CEC are the type of clay minerals present and amount of organic matter.
CEC cannot be interpreted usefully in pond aquaculture. However, it should be noted that 2:1-layered clays such as smectite clays can fix potassium in much greater quantities than the CEC value suggests by sequestering potassium in space between the clay layers. Potassium fixed in this manner has a very low availability.
This process is important in inland culture of marine shrimp in ponds filled with saline well water. Saline well water usually has a low potassium concentration, so potassium chloride is applied to ponds to increase potassium concentration. These applications must be repeated even after cation exchange sites on soils are saturated with potassium because the potassium continues to be fixed within the layers of the clay.
Trace elements
Tests for trace elements – iron, manganese, copper, zinc, boron, cobalt, molybdenum, barium, chromium, lead and others – are routinely made by soil-testing laboratories. Some of these elements are nutrients, but all can be toxic at sufficiently high concentration.
A study conducted at Auburn University in the early 1990s on hundreds of samples from marine and freshwater aquaculture ponds revealed that concentrations of individual trace elements varied by two to three orders of magnitude. In spite of this, ponds from which the samples were taken were successfully producing fish or shrimp. Of course, concentrations greater than those found in the study could be cause for concern.
The greatest concentrations found in the study were iron, 1,200 ppm; manganese, 350 ppm; copper, 11 ppm; zinc, 14 ppm; boron, 24 ppm; cobalt, 3.5 ppm; molybdenum, 1.2 ppm; barium, 4 ppm; chromium, 7 ppm; and lead, 9 ppm.
Obviously, interpretation of trace element data is fraught with difficulty, for no data relates trace element concentrations in bottom soil to aquaculture production variables. Measurement of trace elements in pond soils probably results in more confusion than beneficial information.
(Editor’s Note: This article was originally published in the September/October 2008 print edition of the Global Aquaculture Advocate.)
Now that you've reached the end of the article ...
… please consider supporting GSA’s mission to advance responsible seafood practices through education, advocacy and third-party assurances. The Advocate aims to document the evolution of responsible seafood practices and share the expansive knowledge of our vast network of contributors.
By becoming a Global Seafood Alliance member, you’re ensuring that all of the pre-competitive work we do through member benefits, resources and events can continue. Individual membership costs just $50 a year.
Not a GSA member? Join us.
Author
-

Department of Fisheries and Allied Aquacultures
Auburn University
Alabama 36849 USA
Related Posts
Responsibility
Accuracy of custom water analyses varies
The reliability of trace element analyses reported by custom laboratories cannot be checked by simple techniques, and results may not always be accurate. One should check the reliability of major ion analyses by determining the charge balance and comparing the measured total ion concentration with the total ion concentration estimated from conductivity.
Responsibility
Addressing safety in Latin America’s tilapia supply chain
Over the last decade, the experience gained by many tilapia farmers combined with proficient programs implemented by local governments have significantly improved tilapia production in various Latin American countries like Colombia, Mexico, Ecuador and other important tilapia producers in the region.
Innovation & Investment
Acoustic control improves feeding productivity at shrimp farms
In systems recently developed for shrimp farms, passive acoustic-based technology enables sensor-based control of multiple automatic feeders. Improved growth and feed conversion have been recorded at commercial farms using the technology.
Responsibility
Ammonia nitrogen dynamics in aquaculture
The major sources of ammonia in aquaculture ponds are fertilizers and feeds, and problems with high ammonia are most common in feed-based aquaculture.