PPI: New metric for measuring productivity, predicting profitability
Index is easy to calculate and recommended for inclusion in weekly pond reports
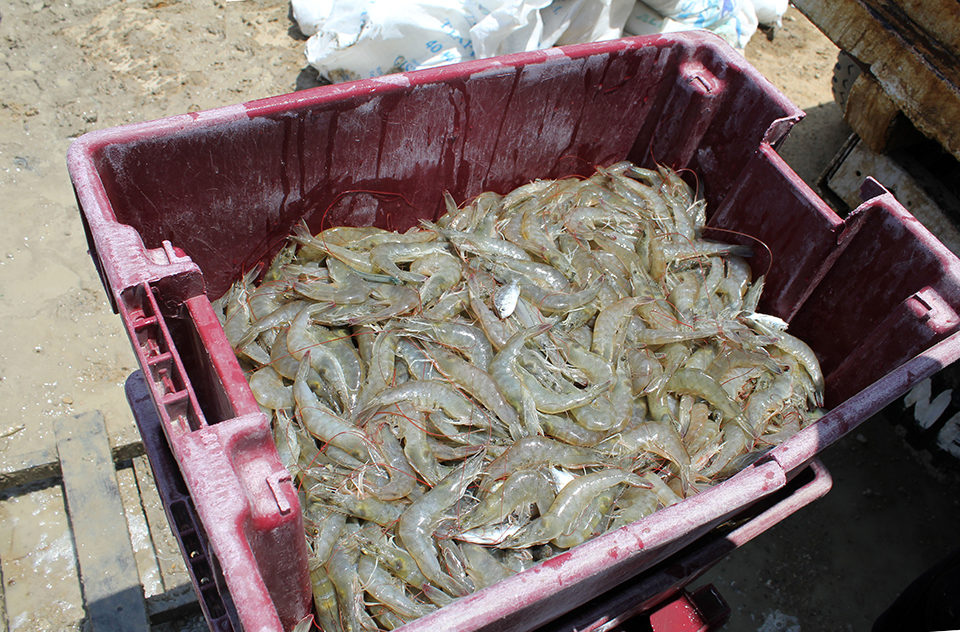
We are all aware of the often-quoted United Nations Food and Agriculture Organization statistics indicating that aquaculture is the fastest-growing form of animal agriculture, averaging 8.5 percent annual productivity increases over the last two decades. This growth has occurred in multiple formats, including increased land acreage and number of facilities, increased use of offshore systems and the intensification of existing facilities.
In planning for continued growth, determining the point of diminishing returns with regard to the intensification or modification of existing facilities is of particular interest. Currently, however, there is no reliable, practical metric that allows financial institutions, farm owners, farm managers and biologists to determine the effects of management protocols on the profitability of a facility or make profitability comparisons between facilities.
“You can’t manage what you can’t measure” is a frequently repeated maxim of effective management. It works well in many cases, but it also implies that we are able to measure the right factors.
Since profits are a primary objective in the shrimp-farming industry, we should be measuring production factors that closely correlate with profitability. Yet if one inquires within the industry as to the most important metrics for predicting performance and profitability, a variety of answers are received.
Some prefer growth rate per week, others feed-conversion ratio. Survivability and cost of feed are also mentioned on the list. The metric identified most frequently as the best is kilograms of shrimp produced per hectare.
Profits, incentives
Vendors who supply goods and services to the industry do so with the expectation that their products will contribute to increased profitability. Since the full economic data of farms is seldom shared with others outside the companies, it is difficult to demonstrate with a high degree of confidence that the goods or services actually do increase profits.
Having a production-type metric that can predict profitability with greater precision is an industry need, but what is the best metric?
Production managers and farm workers are frequently paid financial incentives based on reaching production or profit improvements, or specific targets. However, farm profitability is dependent upon shrimp markets and selling prices for shrimp – outcomes not under the control of the production teams or individuals.
Effective incentive plans should be based on production metrics closely correlated to pond productivity and/or profitability. Again, the question becomes what metrics should be used?
According to the law of diminishing returns, it can be expected that incremental improvements in farm productivity may become smaller over time. This requires that the metrics used to measure these differences become more precise and have the ability to detect and interpret smaller and smaller differences.
Proposed metric
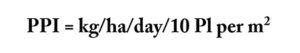
In order to address the questions above, a new metric, the production productivity index (PPI), is proposed for industry consideration. PPI, which reports the daily production for shrimp postlarvae, equalizes all ponds for size, production days and stocking density. PPI can be expressed as follows:
Total production per unit of pond area is a popular metric used to measure both productivity and profitability, but it is greatly influenced by the length of time the shrimp are grown and the number of shrimp stocked per unit of pond area. Therefore, the total production per unit of pond area is equalized in terms of days and stocking densities. With PPI, the unit of time is one day, and the stocking density is equalized to units of 10 animals per square meter.
PPI test model
In testing the index, researchers at Zeigler Brothers collected complete production and economic data for a single crop at one commercial farm in 2011. The crop statistics and general results are presented in Table 1.
Zeigler, Production and economic data, Table 1
| Value | Range | |
|---|---|---|
| Number of Ponds | 27 | |
| Total area (ha) | 77.31 | |
| Pond size (ha) | 2.86 average | |
| Stocking density (postlarvae/m2) | 19.2 average | 2.06-4.81 |
| Number of days | 78.7 average | 14.9-25.0 |
| Weekly temperature (° C) | 24.7 average | 68.0-88.0 |
| Postlarvae size (g) | 15 average | 20.8-26.8 |
| Date stocked | March | 13-23 |
| Date harvested | May, June | |
| Results | ||
| Harvest weight (g) | 10.68 average | 7.75-13.70 |
| Survival (%) | 90.4 average | 68.0-114.0 |
| Feed-conversion ratio | 1.19 average | 1.00-1.37 |
| Gain/week (g) | 0.95 average | 0.80-1.13 |
| Yield (kg/ha) | 1,809 average | 1,081-2,574 |
| Profit/pond (%) | 18.8 average | 9.6-34.8 |
| Production productivity index | 12.0 average | 9.4-14.9 |
The farm contained 27 ponds totaling 77.31 hectares (ha). Pond size averaged 2.86 ha and ranged in size from 2.06 to 4.81 ha. Stocking density averaged 19.2 postlarvae per square meter and ranged 14.9 to 25 per square meter. Production ranged from 68 to 88 days and averaged 78.7 days.
There was some variation in the size of the postlarvae stocked and considerable variation in average weekly temperatures during the production period. Not surprisingly, production results varied significantly among the 27 ponds. Since the overall variation experienced was considered representative of most production situations, however, it was concluded that the data represented a good model for testing the PPI.
Calculations were first made to test the reliability of typical production metrics to predict profitability by calculating the correlation coefficients (Table 2). The correlation coefficients for pond size, stocking density, survival and feed-conversion ratio were all less than 0.1. Other coefficient values were 0.2 for days in the pond, 0.39 for harvest size and 0.46 for the value of the shrimp at harvest. The production metric with the highest correlation to profitability (0.59) was pond yield, but this would not be considered a reliable predictor of profitability.
Zeigler, Correlation to profitability, Table 2
| Production Metric | R2 |
|---|---|
| Pond size | .001 |
| Stocking density | .004 |
| Survival | .010 |
| Feed-conversion ratio | .090 |
| Days in pond | .200 |
| Harvest size | .390 |
| Shrimp value/unit weight | .460 |
| Yield (kg/ha) | .590 |
| Production productivity index | 0.79 |
The data predicting profitability as a function of PPI is expressed in Fig. 1. The regression line predicts an increase in profitability of 6.64 percent for each single unit increase in PPI with a probability of 0.79. Although this correlation is not as high as desired, it is significantly higher than all the other metrics evaluated. At harvest, some of the ponds had larger shrimp that sold at higher prices. Had the shrimp all been sold at the same price, the correlation for PPI would have increased.
Perspectives
PPI is a better predictor of crop profitability and measure of overall pond productivity than the metrics typically used. The index is easy to calculate and recommended for inclusion in weekly pond reports. For semi-intensive farms, values tend to range from 6 to 20 and as high as 24 for indoor recirculating projects.
PPI can be a very useful tool in measuring the effects of different feeds, feed additives, pond additives, management practices and other factors that need to be evaluated with greater precision to constantly improve profitability in the industry. In addition, it has the potential to contribute to more effective incentive and bonus programs.
Also, the production productivity index can be used very effectively in comparing performance among ponds within the same crop, performance among crops or even performance among farms.
The fact that PPI does not take into consideration the value of the shrimp at harvest limits its ability to more closely predict profitability. Also, it was not successful in predicting profitability of a crop that included multiple harvests, where the correlation coefficient was 0.49.
(Editor’s Note: This article was originally published in the January/February 2012 print edition of the Global Aquaculture Advocate.)
Authors
-

Senior Technical Advisor
Past President and Chairman
Zeigler Bros., Inc.
P. O. Box 95
Gardners, Pennsylvania 17324 USA -

Animal Nutritionist
Zeigler Bros., Inc.
P. O. Box 95
Gardners, Pennsylvania 17324 USA
Related Posts
Health & Welfare
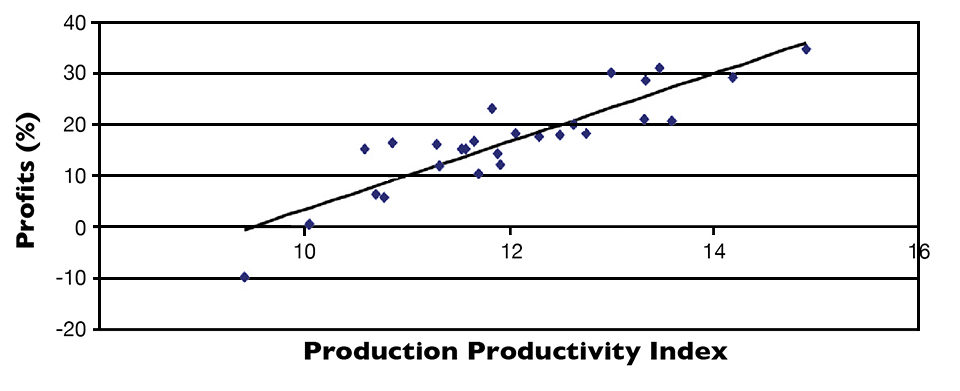
10 paths to low productivity and profitability with tilapia in sub-Saharan Africa
Tilapia culture in sub-Saharan Africa suffers from low productivity and profitability. A comprehensive management approach is needed to address the root causes.
Health & Welfare
A comprehensive look at the Proficiency Test for farmed shrimp
The University of Arizona Aquaculture Pathology Laboratory has carried out the Proficiency Test (PT) since 2005, with 300-plus diagnostic laboratories participating while improving their capabilities in the diagnosis of several shrimp pathogens.
Intelligence
A land grab for salmon (and shrimp) in upstate New York
The operators of Hudson Valley Fish Farm see their inland locale as a pilot to prove that land-based fish farming, located in close proximity to major metropolitan markets, can be successful.
Innovation & Investment
Acoustic control improves feeding productivity at shrimp farms
In systems recently developed for shrimp farms, passive acoustic-based technology enables sensor-based control of multiple automatic feeders. Improved growth and feed conversion have been recorded at commercial farms using the technology.