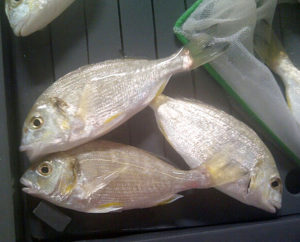
Practical feeds without fishmeal suitable for gilthead sea bream
Study results indicate that fishmeal inclusion level was not directly related to culture performance
In recent years, fishmeal inclusion levels in commercial aquaculture feeds have decreased substantially. High market prices, unpredictable production and increasing ecological concern have been the basis for this decrease.
Previous work by the authors with gilthead sea bream, Sparus aurata, found no statistical performance difference between fish fed diets with 10 percent or 43 percent fishmeal in terms of specific growth rate, feed conversion and somatic indexes. The fishmeal replacement was based on the use of soybean meal, soy protein concentrate (SPC), soybean oil and soy lecithin, and appropriate nutritional compensation in the formula.
In a more recent study, complete fishmeal replacement was applied. Three diets with no fishmeal were compared to diets with 30 or 10 percent fishmeal. Fish oil was also partially replaced by 40 percent vegetable oil in the feeds with 10 percent or no fishmeal.
Test Diets
Five diets with 45 percent crude protein and 20 percent crude fat were evaluated: FM30, FM10, FM0A, FM0B and FM0C. The formulations of the diets are presented in Table 1.
Robles, Composition of the evaluated diets, Table 1
| FM30 | FM10 | FM0A | FM0B | FM0C | |
|---|---|---|---|---|---|
| Fishmeal | 30.00 | 11.06 | – | – | – |
| Soybean meal | 24.94 | 29.62 | 29.10 | 29.11 | 35.00 |
| Soy protein concentrate | 5.79 | 12.79 | 20.17 | 20.16 | 8.74 |
| Wheat gluten | 4.00 | 3.18 | 7.00 | 7.00 | 2.00 |
| Corn gluten | 11.68 | 2.00 | – | – | 2.64 |
| Pea protein concentrate | – | 12.00 | 11.00 | 12.25 | 13.84 |
| Hemoglobin powder | – | – | – | – | 6.00 |
| Wheat flour | 8.00 | 8.00 | 8.00 | 8.00 | 8.00 |
| Vitamin mix | 0.20 | 0.20 | 0.20 | 0.20 | 0.20 |
| Mineral mix | 0.10 | 0.10 | 0.15 | 0.15 | 0.15 |
| Monocalcium phosphate | – | 1.59 | 2.47 | 2.45 | 2.47 |
| Lysine | – | 0.69 | 0.92 | 0.06 | 0.49 |
| Methionine | – | 0.43 | 0.54 | 0.31 | 0.57 |
| Threonine | – | 0.12 | 0.04 | – | 0 |
| Digestibility enhancer | – | 0.50 | 0.50 | 0.50 | 0.50 |
| Palatability enhancer | – | 1.00 | 2.00 | 2.00 | 2.00 |
| Fish oil | 15.29 | 10.72 | 11.91 | 11.81 | 11.40 |
| Soybean oil | – | 5.00 | 5.00 | 5.00 | 5.00 |
| Liquid lecithin | – | 1.00 | 1.00 | 1.00 | 1.00 |
Diet FM30 was a practical formulation representing average fishmeal levels in high-quality feeds for marine fish, with a significant replacement of fishmeal with soybean protein. For this diet, 41 percent of dietary protein was provided by fishmeal, and 26 percent was provided by defatted soybean meal.
In the FM10 diet, only 15 percent of the protein was provided by fishmeal, and 59 percent of the dietary fat was provided by fishmeal and fish oil. The FM10 formulation was compensated to improve the essential amino acid balance using pea protein and amino acid supplementation with lysine, methionine and threonine to approach the amino acid profile of whole bream.
Supplemental phosphorus was added to increase the available phosphorus level to 0.65 percent. Lipid digestibility was stimulated by adding lecithin and a digestive aid, as lipid digestion/absorption is a documented problem in carnivorous fish fed high levels of vegetable protein. Palatability was improved by the addition of a palatability enhancer.
Diet FM0A was based on the same nutritional principles as FM10, but the level of n3 highly unsaturated fatty acids was kept above requirement using additional fish oil. For the FM0B diet, the proportions of the amino acids lysine, methionine and threonine were maintained but formulated at a level similar to the control FM30 to challenge the costly need for increasing the absolute levels of essential amino acids in zero-fishmeal formulations with high levels of plant protein.
The FM0C diet was based on the FM0A formulation, but included hemoglobin powder, a legal animal protein for the European market, as a source of highly digestible protein and essential amino acids as a partial replacement of SPC. This ingredient is often preferred over SPC by feed millers for marine carnivorous fish because it supplies highly digestible animal protein.
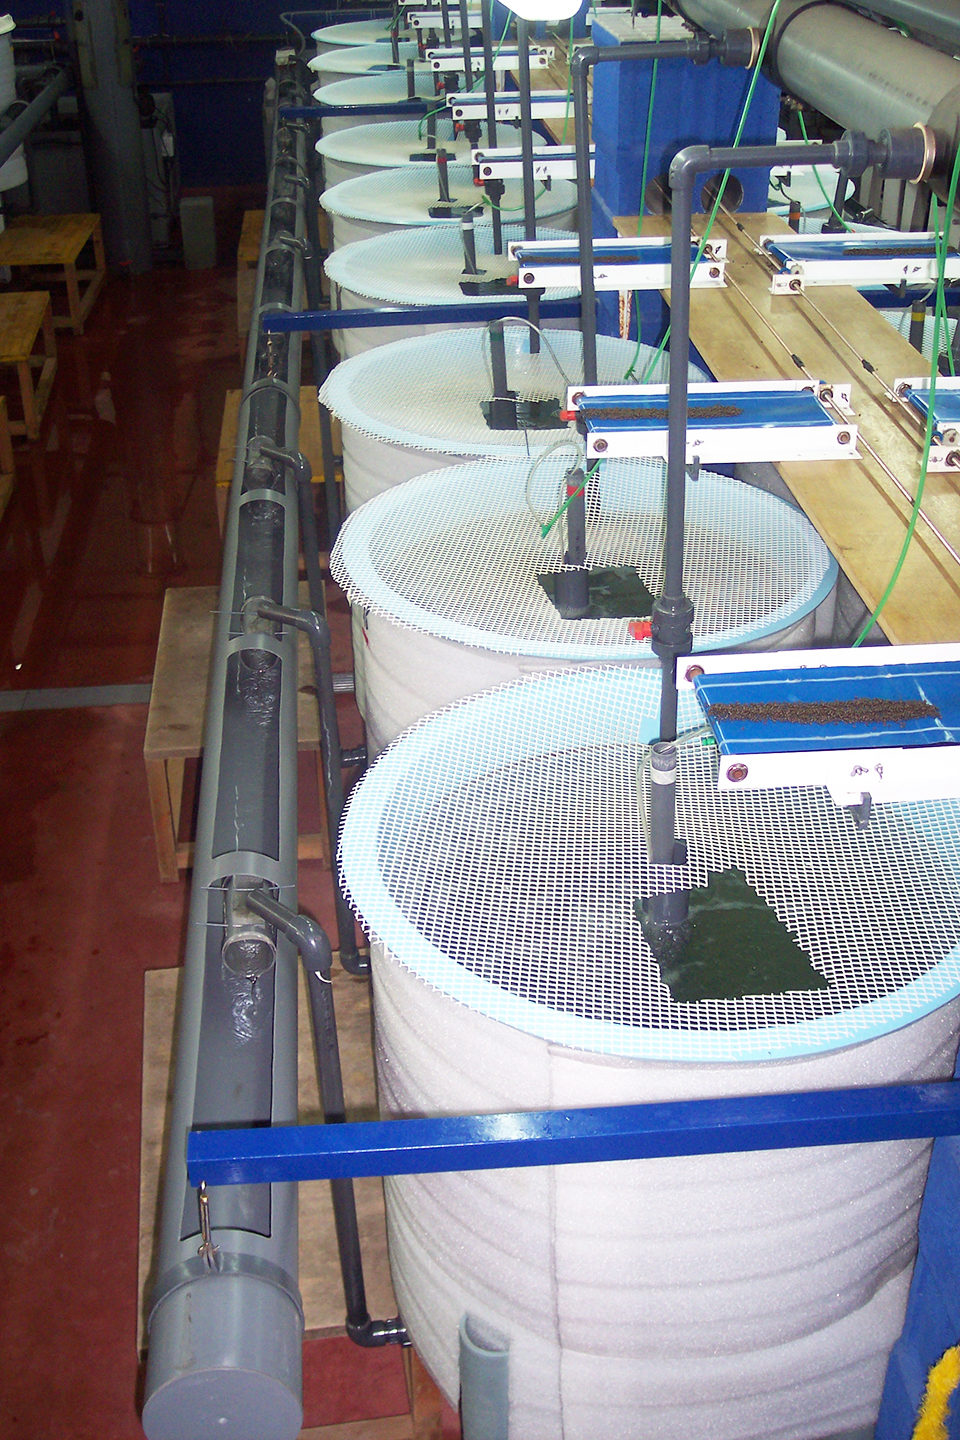
Experimental setup
Gilthead sea bream juveniles with an initial average body weight of 13 g were fed the experimental diets for 10 weeks. The study was performed in an indoor recirculation system in 300-L tanks. The recirculation system included mechanical and biofiltration units, a protein skimmer and a sand filter.
The fish were reared in well water with an average temperature of 21 ± 1 degrees-C and average salinity of 36 ± 1 g/L. Daily water renewal was 7 to 10 percent, depending on water quality conditions. Fish were stocked at 35 individuals/tank and acclimatized to the system for two weeks. Photoperiod was set at 12 hours of light daily.
The fish received the experimental diets from automatic belt feeders on top of each tank. Feed rations were calculated on a percentage of body weight for all the treatments. Uneaten pellets were collected at the outlet of each tank. and feed intake was corrected for uneaten feed. Temperature and dissolved-oxygen levels were measured daily, while total ammonia nitrogen, nitrite, pH and salinity were measured three times weekly.
Results
Overall, sea bream performance was excellent. Survival was above 95 percent in all treatments. Specific growth rates ranged 1.83-1.95 percent/day. Analyses showed significant differences among treatments for final weight, weight gain, growth rate, feed conversion and other factors (Table 2).
Robles, Growth performance and feed conversion, Table 2
| Diet | FM30 | FM10 | FM0A | FM0B | FM0C | P Value |
|---|---|---|---|---|---|---|
| Survival | 95.24 ± 4.36 | 97.14 ± 2.86 | 100.00 ± 0 | 100.00 ± 0 | 97.14 ± 0 | – |
| Initial weight (g) | 13.13 ± 0.18 | 12.97 ± 0.20 | 13.00 ± 0.33 | 13.01 ± 0.15 | 12.97 ± 0.19 | – |
| Final weight (g) | 61.47 ± 2.19bc | 66.93 ± 1.92a | 63.65 ± 1.48b | 62.79 ± 0.59bc | 60.29 ± 1.86c | 0.0094 |
| Weight gain (g) | 48.61 ± 2.15bc | 53.97 ± 1.73a | 50.67 ± 1.22b | 49.78 ± 0.44bc | 47.32 ± 1.67c | 0.0040 |
| Specific growth rate (%/day) | 1.84 ± 0.04cd | 1.95 ± 0.02a | 1.89 ± 0.02b | 1.87 ± 0bc | 1.83 ± 0.02d | 0.0003 |
| Total feed/fish (g) | 58.88 ± 1.71 | 59.00 ± 1.18 | 57.17 ± 1.41 | 56.73 ± 0.75 | 55.99 ± 1.15 | – |
| Daily feed intake (% average body weight) | 1.87 ± 0d | 1.76 ± 0.02a | 1.78 ± 0.01ab | 1.78 ± 0.01abc | 1.82 ± 0.03c | 0.0012 |
| Feed-conversion ratio | 1.21 ± 0.02c | 1.09 ± 0.02a | 1.13 ± 0.01ab | 1.14 ± 0.01b | 1.18 ± 0.03c | 0.0005 |
| Protein utilization | 1.83 ± 0.03c | 2.03 ± 0.03a | 1.97 ± 0.02ab | 1.95 ± 0.01b | 1.88 ± 0.04c | 0.0004 |
| Hepatosomatic index (%) | 1.19 ± 0.14 | 1.13 ± 0.10 | 1.13 ± 0.11 | 1.16 ± 0.12 | 1.17 ± 0.13 | – |
| Viscerosomatic index (%) | 6.09 ± 0.32 | 5.40 ± 0.21 | 5.37 ± 0.53 | 5.39 ± 0.46 | 5.45 ± 0.40 | – |
Fish performance with diet FM30 was significantly lower (P < 0.0094) than with diet FM10 for specific growth rate (SGR), feed-conversion ratio (FCR) and protein utilization. There was no significant difference between results for the FM30 and FM0A treatments, showing that complete replacement of fishmeal is possible for sea bream juveniles.
Fish fed FM0A and FM0B had very similar performances, with no significant difference in growth, feed conversion and protein utilization. The results for treatment FM0B were comparable to those for FM0C in terms of growth only. FCR and protein utilization values were significantly different for these two experimental diets.
No statistically significant difference was found among the five diets for hepatosomatic or viscerosomatic indexes.
Perspectives
The study results indicated that fishmeal inclusion level was not directly related to culture performance, since the results obtained with diet FM10 were better than those with diet FM30, and the three diets without fishmeal performed as well as the FM30 control diet. Feeding FM10 yielded 6 percent better SGR, 10 percent improved FCR and 11 percent better protein utilization than feeding diet FM30.
Total replacement of fishmeal is possible. As shown in the results for the FM0A and FM0B diets, improvement of essential amino acid balance, increased available phosphorus and digestibility enhancement were the basis for nutritional compensation at 100 percent fishmeal replacement. The FM0C diet presented the lowest performance of the three FM0 diets, indicating hemoglobin powder was inferior to SPC as a protein source. However, diet FM0C performed as well as the FM30 control.
(Editor’s Note: This article was originally published in the September/October 2012 print edition of the Global Aquaculture Advocate.)
Authors
-

Technical Director, Test Center
Centro Tecnológico de la Acui
Muelle Comercial s/n
Puerto de Santa María 11500, Cádiz, Spain -

NutriAd International
Turnhout, Belgium -

NutriAd International
Turnhout, Belgium -
Centro Tecnológico de la Acui
Muelle Comercial s/n
Puerto de Santa María 11500, Cádiz, Spain -
U.S. Soybean Export Council
St. Louis, Missouri, USA
Related Posts
Aquafeeds
Aquaculture Exchange: Giovanni Turchini, Deakin University, part 2
In the second part of our interview with the associate head of research at the School of Life and Environmental Sciences at Deakin University (Australia) he discusses the various alternative sources of omega-3 fatty acids coming on to the market and why research is crucial to advancing aquaculture.
Health & Welfare
Dietary acidification in aquaculture
Much of the chemical breakdown of foodstuffs begins in the stomachs of animals through acidification. Effective use of digestive biology is a goal in aquaculture, so dietary acidifiers have been gaining interest in recent years.
Aquafeeds
A look at phospholipids in aquafeeds
Phospholipids are the major constituents of cell membranes and are vital to the normal function of every cell and organ. The inclusion of phospholipids in aquafeeds ensures increased growth, better survival and stress resistance, and prevention of skeletal deformities of larval and juvenile stages of fish and shellfish species.
Innovation & Investment
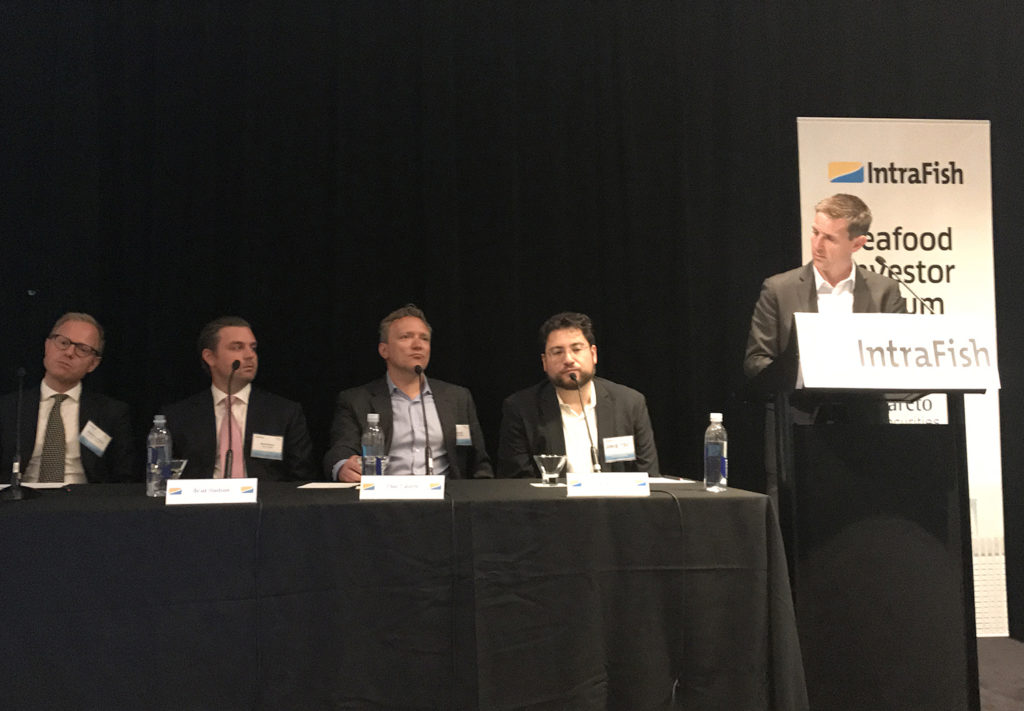
At seafood investor forum, a ‘blue-sky’ outlook and a search for the next salmon
At the IntraFish Seafood Investor Forum in New York, “all roads lead to salmon.” Buoyed by high prices and soaring demand, the sector is an example worth following. But it’s not without its challenges.