Research reveals inbreeding depression in Pacific white shrimp
Hatch rates for the inbred families were much lower than for outbred families
As the global shrimp-farming industry matures, the use of domesticated, genetically improved shrimp stocks will become more common. In closed populations under selection, inbreeding is an inevitable effect. Inbreeding depression, the loss of vigor among offspring when related individuals mate, can occur rapidly when intense selection is coupled with a narrow genetic base, as in a small population size. Yet little is known about the potential deleterious effects of inbreeding on penaeid shrimp.
Directed management strategies can slow the accumulation of inbreeding in closed populations. However, not knowing the severity to which inbreeding affects performance – or even what traits are affected – makes it difficult to determine the importance of avoiding inbreeding when designing a shrimp-breeding program.
Experimental families
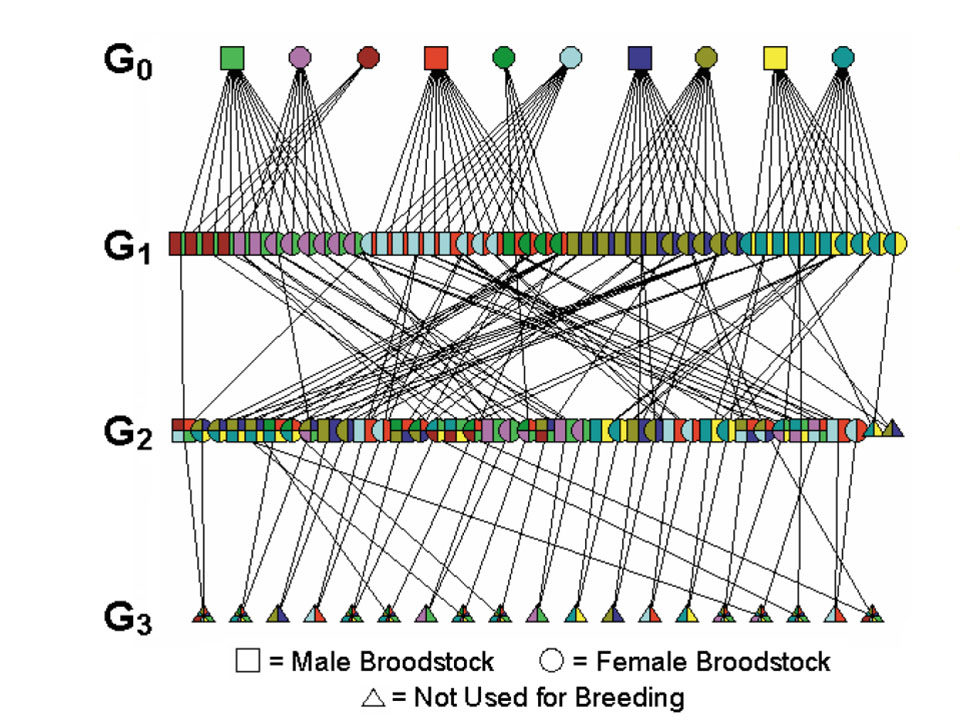
A two-year study at the Oceanic Institute in Waimanalo, Hawaii, USA, investigated the effects of inbreeding on the hatchery and pond performance of Pacific white shrimp (Litopenaeus vannamei). The pedigree data comprised a total of four generations, G0-G3. G0 founders were collected from the wild and assumed to be unrelated, with an inbreeding coefficient of 0. Two successive generations (G2 and G3) of inbred and outbred families were produced and compared.
Inbred families were produced by mating siblings. Outbred families were produced by mating two unrelated individuals. In G2, 11 inbred and 12 outbred families were produced from six G1 families. Nine inbred and 10 outbred families were produced in G3. The resulting inbreeding coefficient values for outbred and inbred families were 0.00 and 0.25, respectively, for G2 and 0.00 and 0.375, respectively, for G3.
Measuring inbreeding depression
The effects of inbreeding were determined by quantifying four performance characteristics: hatch rate, hatchery survival to PL8, pond growth rate, and pond survival. Nutrition, size, age, lighting, and water quality were similar for all broodstock used in the experiment.
Environmental variability also was controlled, as inbred and outbred families were produced together over a 10-day period, reared in the same hatchery and nursery systems, and grown together in the same pond. Thus, differences in performance characteristics between the outbred and inbred families were attributed to inbreeding.
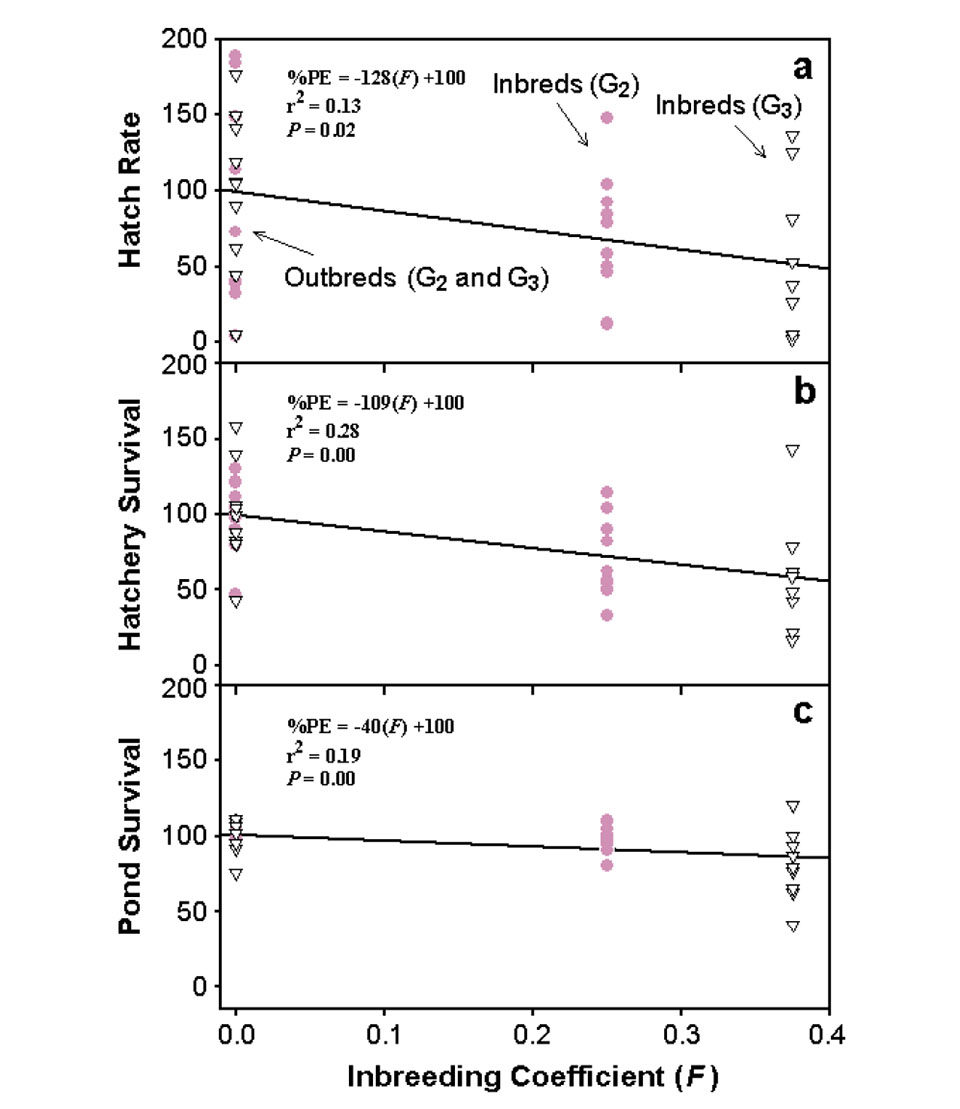
To determine the magnitude of inbreeding depression, a percent phenotypic expression ( percent PE) of each trait was calculated for each family using the formula: percent PE = (family mean/generation specific outbred family group mean) x 100. These values were then regressed against the inbreeding coefficient using linear regression.
Evidence for depression
Hatch rates for the inbred families were 33.3 percent lower than for outbred families in G2 and 47.1 percent lower in G3 (Table 1). Also, there was a significant negative correlation between percent PE-hatch rate and level of inbreeding (Fig. 1a). For every 10 percent increase in inbreeding, hatch rate decreased by 12.8 percent.
Hatchery survival for inbred families was 31.5 percent lower than for outbred families in G2 and 38.7 percent lower in G3. As with hatch rate, a significant negative correlation was found between percent PE-hatchery survival and level of inbreeding (Fig. 1b). For every 10 percent increase in inbreeding, hatchery survival decreased by 10.9 percent.
Pond survival was greater than 85 percent for both inbred and outbred families in G2. In G3, pond survival for the outbred families was 19.5 percent higher than for inbred families. There was a significant negative correlation between percentPE-pond survival and level of inbreeding (Fig. 1c). Although not as dramatic as for hatch rate and hatchery survival, pond survival decreased by 4.0 percent for every 10 percent increase in inbreeding. The growth of inbred and outbred families was similar in G2 and G3.
NMoss, Hatchery and growout performance, Table 1
| G | Trait | Outbred | Inbred | Difference |
|---|---|---|---|---|
| 2 | Hatch rate | 49.81 ± 34.39 | 33.25 ± 20.06 | -33.3% |
| 3 | (%) | 56.50 ± 29.28 | 29.88 ± 29.06 | -47.1% |
| 2 | Hatchery | 58.21 ± 4.00 | 39.87 ± 4.17 | -31.5% |
| 3 | Survival (%) | 58.01 ± 18.45 | 35.54 ± 21.95 | -38.7% |
| 2 | Pond survival | 87.17 ± 4.86 | 85.45 ± 7.35 | -2.0% |
| 3 | (%) | 67.35 ± 7.43 | 54.22 ± 15.57 | -19.5% |
| 2 | Pond growth | 1.06 ± 0.07 | 1.06 ± 0.08 | 0.0% |
| 3 | (g/week) | 0.73 ± 0.06 | 0.74 ± 0.10 | 1.4% |
Conclusion
A study of Pacific white shrimp found hatch rate and hatchery survival were negatively affected by inbreeding, with expected phenotypic depressions greater than 10 percent for every 10 percent increase in inbreeding. Pond survival also was negatively affected, but to a lesser extent. Inbreeding appeared to have no effect on shrimp growth at the levels tested.
This study provides an estimate of the degree to which inbreeding can affect shrimp performance. It can be used to balance the detrimental effects of inbreeding against the added expense of avoiding inbreeding through methods such as tagging and pedigree tracking.
(Editor’s Note: This article was originally published in the February 2004 print edition of the Global Aquaculture Advocate.)
Now that you've reached the end of the article ...
… please consider supporting GSA’s mission to advance responsible seafood practices through education, advocacy and third-party assurances. The Advocate aims to document the evolution of responsible seafood practices and share the expansive knowledge of our vast network of contributors.
By becoming a Global Seafood Alliance member, you’re ensuring that all of the pre-competitive work we do through member benefits, resources and events can continue. Individual membership costs just $50 a year.
Not a GSA member? Join us.
Authors
-

The Oceanic Institute
41-202 Kalanianaole Hwy.
Waimanalo, Hawaii 96795 USA -
The Oceanic Institute
41-202 Kalanianaole Hwy.
Waimanalo, Hawaii 96795 USA -
The Oceanic Institute
41-202 Kalanianaole Hwy.
Waimanalo, Hawaii 96795 USA
Related Posts
Health & Welfare
‘Big picture’ connects shrimp disease, inbreeding
Disease problems on shrimp farms may be partly driven by an interaction between management practices that cause inbreeding in small hatcheries and the amplification by inbreeding of susceptibility to disease and environmental stresses.
Health & Welfare
10 paths to low productivity and profitability with tilapia in sub-Saharan Africa
Tilapia culture in sub-Saharan Africa suffers from low productivity and profitability. A comprehensive management approach is needed to address the root causes.
Health & Welfare
A holistic management approach to EMS
Early Mortality Syndrome has devastated farmed shrimp in Asia and Latin America. With better understanding of the pathogen and the development and improvement of novel strategies, shrimp farmers are now able to better manage the disease.
Aquafeeds
ASAIM addresses challenges to growth of marine fish farming in Southeast Asia
In its efforts to advance sustainable aquaculture practices and the use of soy-based feeds in Southeast Asia, the American Soybean Association International Marketing Program (USAIM) has identified several challenges.