Shrimp product diversification in Japan and the United States during the 1990s
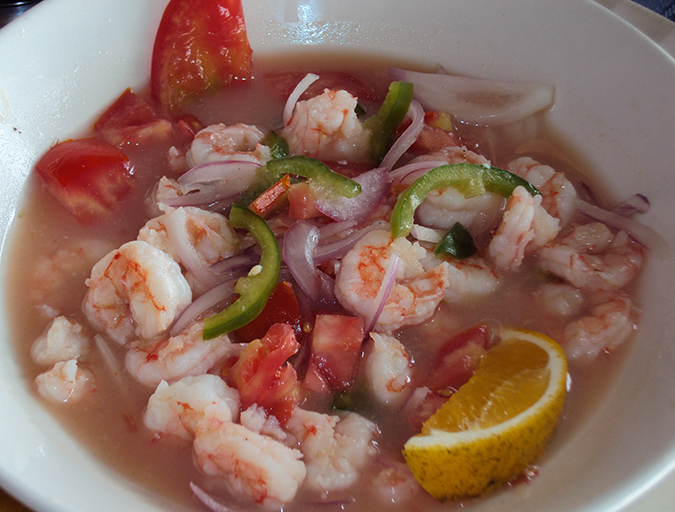
Value-added products are being developed in response to growing demand for quality and convenience
Frozen shrimp is a common product in international markets, where Japan and the United States are the leading importers. The current market expansion offers enormous potential for a wide range of value-added shrimp products in a variety of final preparation forms.
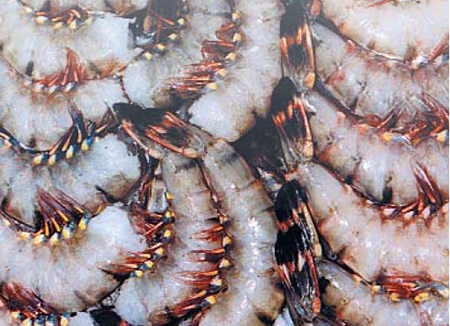
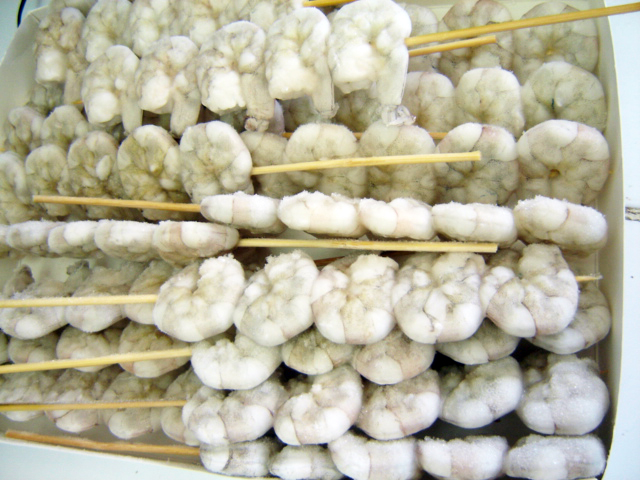
The traditional value-added shrimp products are individual quick frozen, breaded, battered, and recipe prawns. Within these groups there has been an opportunity for sophistication in terms of glaze level, flavoring, and preparation techniques, such as tail-on breaded, or battered shrimp and shrimp rolls.
A study of shrimp exports to the Japanese and U.S. markets during the 1991-96 period showed increasing product diversification and demand for value-added shrimp products. This study used the “revealed” comparative advantage (RCA) index, obtained by dividing a country’s share in the exports of each type of shrimp product by its share in the combined exports of shrimps of the top-10 shrimp exporting countries.
Japanese shrimp market
In 1996, total shrimp imports to Japan were 312,579 metric tons (MT), valued at 322,414 million yen (U.S. $3.14 billion). About 92 percent of total shrimp imports were frozen shrimp. Major shrimp exporters to the Japanese market were Indonesia, India, Thailand, Vietnam, China and Greenland. Shrimp from these countries shared 75 percent of total Japanese shrimp imports in 1996.
Frozen shrimp
Thailand, China and the Philippines had a comparative disadvantage for frozen shrimp that year, as frozen shrimp exports from these countries to Japan were declining. Farmed shrimp production was lower due to shrimp diseases. In the case of Thailand, the price of frozen shrimp was relatively higher than in other exporting countries. This led Thailand to convert much of its frozen shrimp production into value-added products.
China used to be one of the major shrimp exporters, but in the past few years it has become one of the main shrimp importers in Asia. India, Canada and Indonesia had a comparative advantage in exporting shell-on frozen shrimp, because these countries exported large-sized frozen shrimp to the Japanese market, which has a relatively higher price and demand than the U.S. market.
Other products
Other product forms of exported shrimp (e.g. live, fresh or chilled, dried, salted, smoked, and prepared [containing rice]) still had an insignificant share in the Japanese market, with approximately 1 percent of total imports in 1996. The annual RCA index of exported live shrimp indicated that during the past few years, Australia showed the strongest comparative advantage.
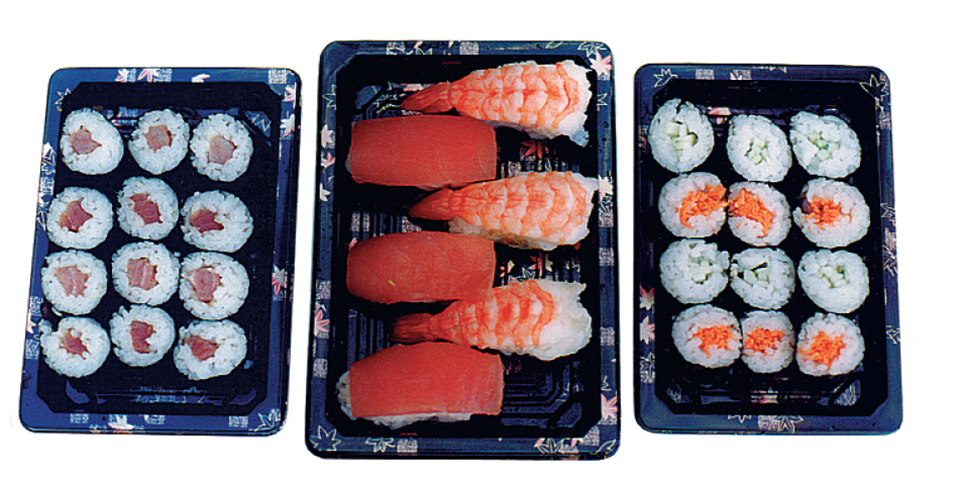
In the Japanese market, live shrimp include mostly Kuruma shrimp (P. japonicus), both from local sources and imports. Australia and Iceland had a comparative advantage for fresh or chilled product. These imported shrimp were consumed domestically as sashimi (raw fish) and sushi, a typical item of Japanese cuisine in which a piece of fish or other seafood is placed on top of a bite-sized portion of vinegared rice.
China had a comparative advantage in dried, salted, or brine shrimp products during the 1991-96 period, while Vietnam had the highest comparative advantage in 1996. In Japan, some dried shrimp are imported for the specialty markets. Japan’s cooked and prepared shrimp import stood at 6.6 percent of total import in 1996, up from 2 percent in 1991.
Thailand, Indonesia, Canada, and Iceland showed a comparative advantage in exporting boiled shrimp. Thailand and Indonesia produced cooked tropical shrimp, while Canada and Iceland produced cooked cold-water product. Japan imports cooked, butterflied and tail-on shrimp for use in sushi.
Indonesia, India, Vietnam, and China had the comparative advantage in exporting prepared or preserved shrimp. Japanese manufacturers took advantage of low production costs in Asia and applied their technical expertise to improve food ingredients, products, and the technical skills of local manufacturers in shrimp-exporting countries.
U.S. shrimp market
In 1996, total U.S. shrimp imports were 264,207 MT, valued at U.S. $2.46 billion. The major shrimp exporters were Thailand, Ecuador, and Mexico. Thailand had market share of about 27.5 percent of total U.S. imports in 1996 – up from 18.6 percent in 1991. Ecuador and Mexico accounted for 16.7 percent and 11.7 percent of market share, respectively, in 1991.
In the U.S. shrimp market, the RCA contribution of shell-on frozen shrimp and peeled frozen shrimp from each exporting country is a relatively important factor because of their large share of total U.S. imports. The decrease of the market share of these two products indicates that there is more product diversification in the U.S. shrimp market.
Frozen shrimp
For large-sized, shell-on frozen shrimp, Mexico, Indonesia, and Bangladesh have a comparative advantage. Thailand, Ecuador, Honduras, and Panama, on the other hand, appear to have a comparative advantage in exporting middle-sized and small-sized shrimp. India and China had the highest comparative advantage in exporting peeled frozen shrimp during the same period.
Peeled shrimp is the raw material used for breaded products, and smallsized shrimp are preferred for that purpose. Moreover, peeled white shrimp found in China, Ecuador, Honduras and Panama are usually preferred to other colors. This is another reason why China managed to supply such a huge volume to the U.S. market during the period of the study.
Other products
Fresh, dried, salted, brine shell-on, and peeled shrimp shared 0.2 to 3.2 percent of total U.S. shrimp imports in 1996. Canada had the strongest comparative advantage in exporting these products, and also had a comparative advantage in exporting frozen shrimp in airtight containers. High-production technology is a crucial factor in producing these products, and Canada takes full advantage of its capacity in this field.
Shrimp frozen in airtight containers, breaded frozen, canned, and other preparations were still insignificant in the U.S. market, with only 0.8 percent of total imports in 1996. Thailand, India, Indonesia, Canada, and China showed a comparative advantage in exporting these products. Other preparations of frozen shrimp accounted for 10.6 percent of total imports in 1996, increasing from 3.4 percent in 1991. In this category, Thailand had a significant comparative advantage among all exporting countries, followed by India and Canada.
Conclusion
In both Japan and the United States, almost all the top shrimp exporting countries had comparative neutrality in exporting frozen shrimp. Fluctuations of the revealed comparative advantage index during the 1991-96 period indicated there was an increase in shrimp product diversification. The results also showed Thailand and China have a comparative advantage in exporting value-added shrimp products in the Japanese and U.S. markets. Value-added products are being developed in response to growing demand for quality and convenience in prepared dishes. Developing countries have great potential to produce these products, as they can take full advantage of low labor costs and high-quality but low-priced raw materials.
(Editor’s Note: This article was originally published in the December 2000 print edition of the Global Aquaculture Advocate.)
Now that you've reached the end of the article ...
… please consider supporting GSA’s mission to advance responsible seafood practices through education, advocacy and third-party assurances. The Advocate aims to document the evolution of responsible seafood practices and share the expansive knowledge of our vast network of contributors.
By becoming a Global Seafood Alliance member, you’re ensuring that all of the pre-competitive work we do through member benefits, resources and events can continue. Individual membership costs just $50 a year.
Not a GSA member? Join us.
Authors
-

Faculty of Fisheries
Kagoshima University
Kagoshima, Japan -
Faculty of Fisheries
Kagoshima University
Kagoshima, Japan -
Faculty of Fisheries
Kagoshima University
Kagoshima, Japan
Related Posts
Intelligence
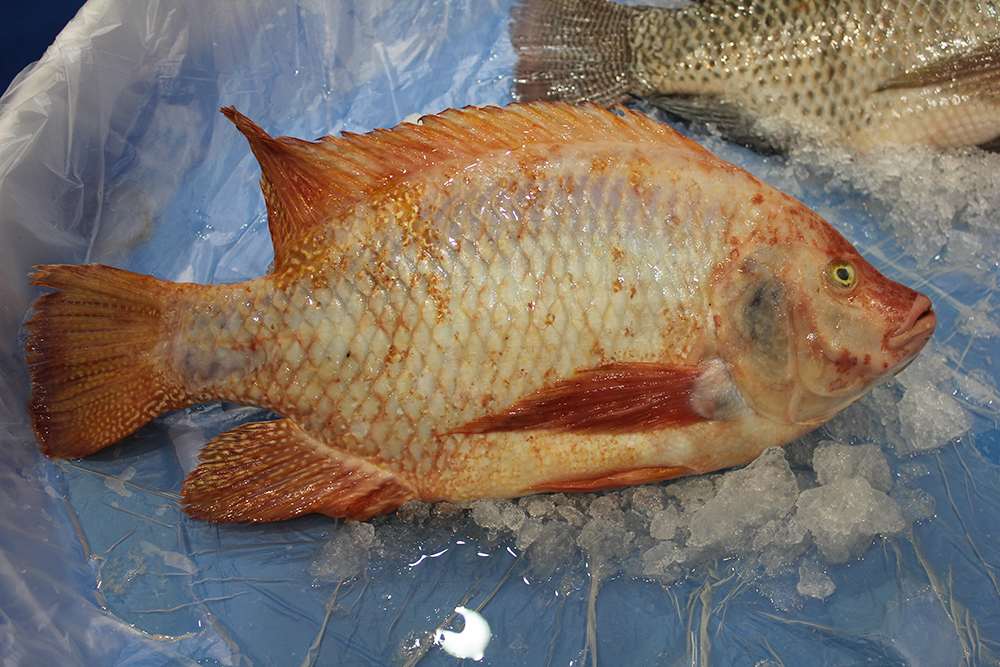
Adding value to tilapia to tap into U.S. market
New markets for tilapia and expansion of existing ones can be created by planning and implementing properly designed geographic strategies to meet discriminating consumer preferences. Low labor costs in most producing countries promotes value-adding by the production of fresh fillets.

Intelligence
Bloggin’ up to Boston: Quick hits from Seafood Expo North America
News and notes from Seafood Expo North America in Boston, Mass., USA, 19-21 March, 2017. Posts by James Wright, Editorial Manager of the Global Aquaculture Alliance.
Intelligence
Facts about shrimp and cholesterol
Many people, including health-conscious consumers, are concerned about the cholesterol content of foods such as meat, eggs and dairy products. In the case of shrimp, the cholesterol story is different because a number of research studies have demonstrated that the high percentage of “good fats” in shrimp reduce the impact of cholesterol, and that a majority of people can eat shrimp as part of a balanced diet.
Intelligence
Value-added shrimp products
Because some value-added shrimp products are not affected by U.S. antidumping tariffs, various imports in this classification have greatly increased.