Soy protein concentrate replaces fishmeal in fingerling test diets in China
Trials conducted with carp, grass carp, tilapia and channel catfish
A series of feeding trials conducted in 2007 by the American Soybean Association International Marketing (ASA-IM) program with the cooperation of local and regional companies and institutions evaluated a soy protein fingerling feed for key cultured freshwater fish species in China.
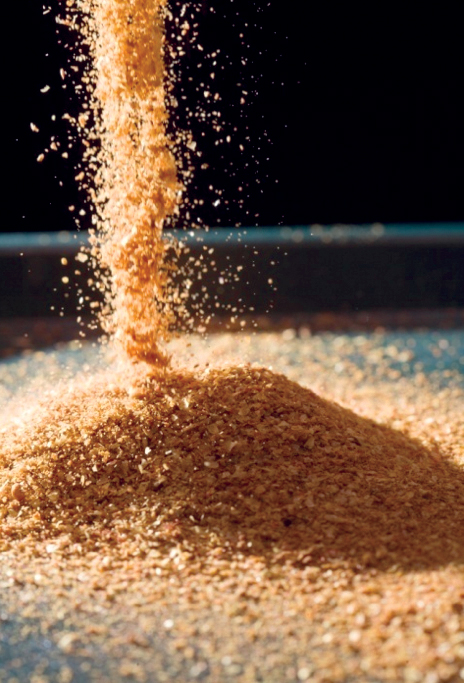
The feed used soy protein concentrate as a replacement for fishmeal as a main source of protein. The objectives of replacing fishmeal with soy protein were to provide feed millers with an option to reduce costs associated with the rising price of fishmeal and improve industry sustainability by providing a feed in which the majority of protein is supplied from renewable plant sources.
Feeding protocols
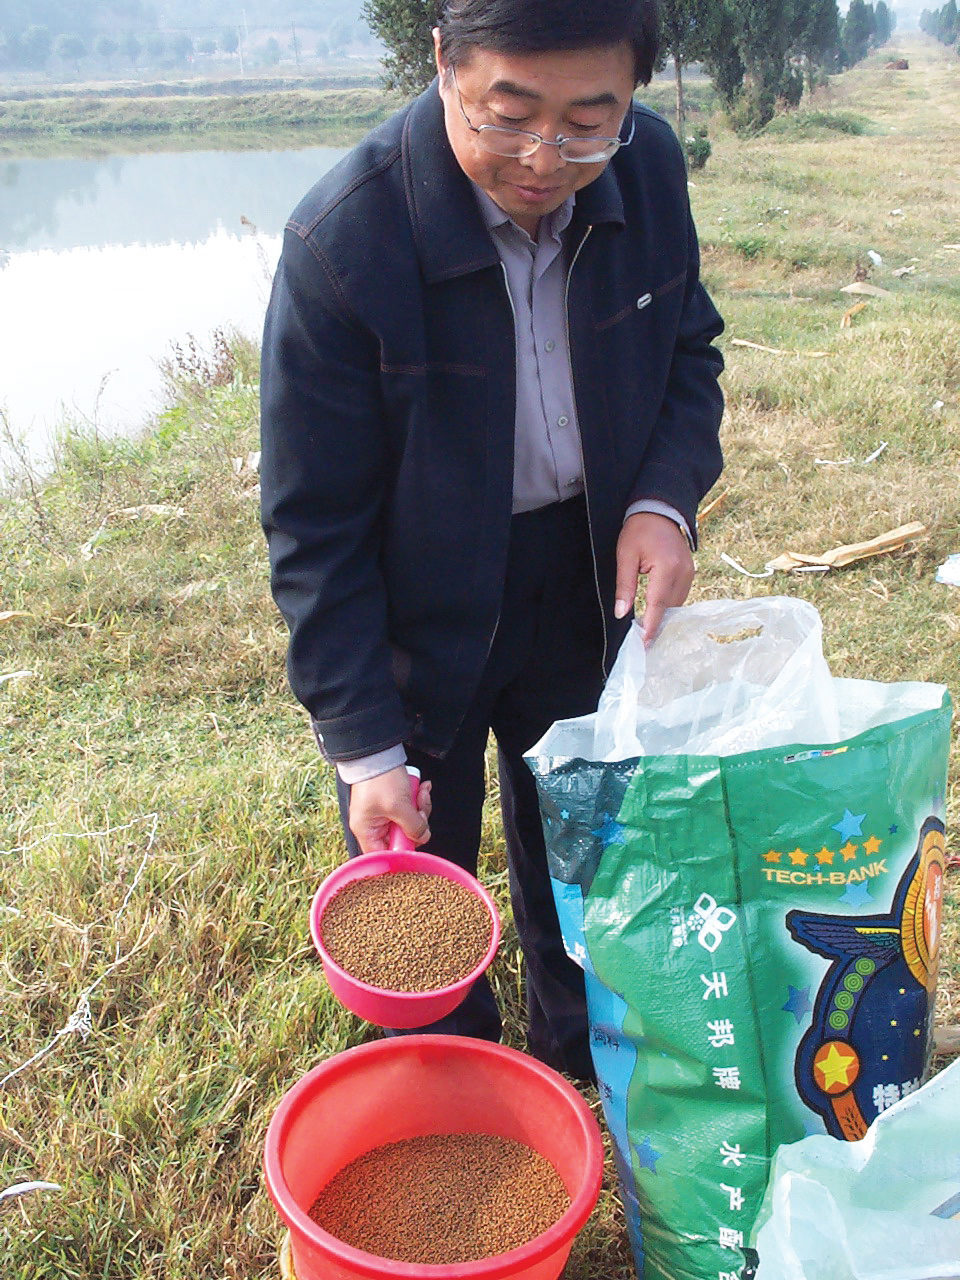
Two test feeds were formulated to reflect a balance of 36 percent protein and 7 percent fat. The feed with fishmeal contained 13.5 percent fishmeal, while the soy protein feed replaced fishmeal with 65 percent crude protein animal-grade soy protein concentrate. As shown in Table 1, the diets were formulated to be nutritionally equivalent. Methionine was included in the soy-supplemented feed to make it more equivalent to the fishmeal diet. Both feeds were given in extruded, floating pellet form with an initial pellet size of 1.5 mm to several fish species.
Cremer, Formulas for the 36 percent-protein, 7 percent-fat test diets, Table 1
| Ingredient | Fishmeal Diet % | Soy Protein Diet % |
|---|---|---|
| Soybean meal | 42.00 | 30.00 |
| Wheat flour | 20.90 | 14.00 |
| Wheat middlings | – | 18.50 |
| Soy protein concentrate | – | 16.00 |
| Fishmeal (anchovies) | 13.50 | – |
| Dried grain solubles | 10.00 | – |
| – | – | – |
| Corn gluten meal | 5.00 | 5.00 |
| Blood meal | – | 5.00 |
| Soy lecithin/corn blend | 3.00 | 3.00 |
| Fish oil | 2.60 | 3.00 |
| Calcium phosphate | 1.60 | 2.70 |
| Soy oil | 0.50 | 1.50 |
| Vitamin premix | 0.50 | 0.50 |
| Mineral premix | 0.25 | 0.25 |
| Choline chloride | – | 0.21 |
| Methionine, 84% active | – | 0.19 |
| Mold inhibitor | 0.10 | 0.10 |
| Vitamin C, 35% active | 0.03 | 0.03 |
Common carp
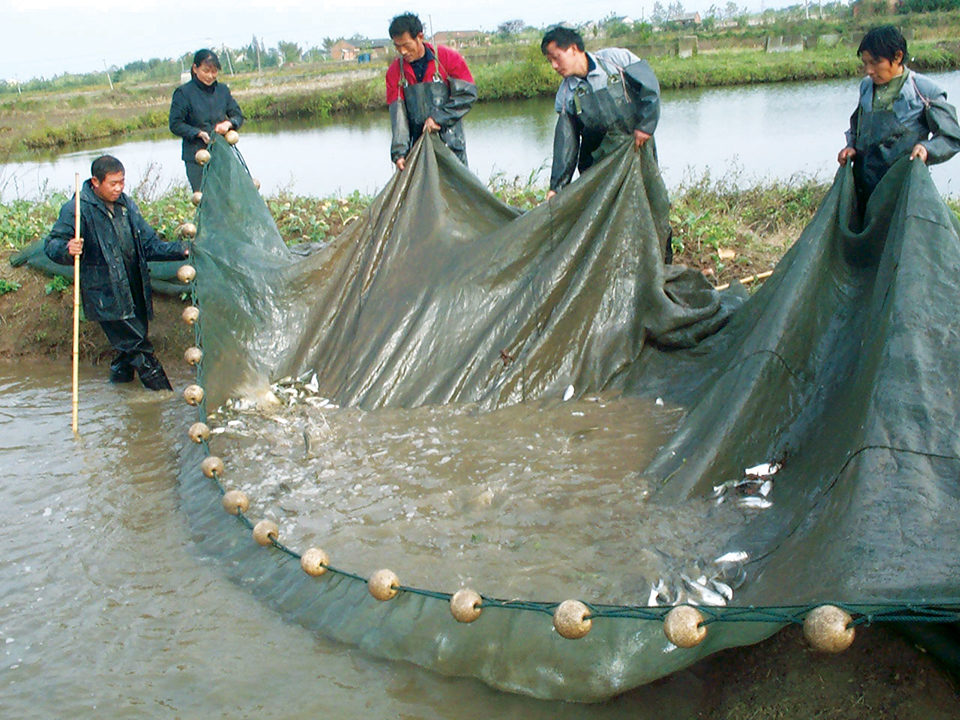
The production of common carp fingerlings with the test feeds was evaluated in a pond trial at the extension demonstration fish farm of the Heilongjiang Provincial Fishery Extension Center in Harbin using the Songpu carp strain. Applying the ASA-IM 80:20 model, in which 80 percent of harvested biomass comes from a high-value species and the remainder from a lesser-value “service” species that improves the culture environment, advanced common carp fry of 0.5-gram size were stocked in six ponds at a density of 60,000 fish per hectare (ha), together with silver carp fry at 15,000 per ha in mid-June 2007.
Common carp in all six ponds were fed a 41 percent-protein, 11 percent-fat fry diet until they reached sizes of 2 to 3 grams, at which time the fish were weaned to the test diets. Common carp in three of the ponds received the feed with fishmeal for 69 days, while common carp in the other three ponds were fed the feed with soy protein for the same duration. The common carp in all ponds were fed to satiation twice daily.
Fish performance
There was no significant (P > 0.05) difference in common carp performance with the two fingerling diets. Carp given feed with added soy protein grew to an average weight of 135.5 grams during the trial, while those fed the feed with fishmeal reached an average 132.0 grams (Table 2). Biomass at harvest averaged 6,524 kg per ha for common carp fed the soy-supplemented feed and 6,699 kg per ha for fish that received the fishmeal feed. An additional 821 kg per ha and 783 kg per ha of silver carp were produced in each of the ponds receiving the soy and fishmeal feeds, respectively.
Cremer, Performance of common carp and silver carp fingerlings, Table 2
| Pond/Feed Treatment | Harvest Weight (g) Common Carp | Harvest Weight (g) Silver Carp | Production (kg/ha) Common Carp | Production (kg/ha) Silver Carp | Survival (%) Common Carp | Survival (%) Silver Carp | Feed-Conversion Ratio |
|---|---|---|---|---|---|---|---|
| Fishmeal 1 | 130 | 58 | 6,493.5 | 775.5 | 83.3 | 89.9 | 1.13 |
| Fishmeal 2 | 126 | 59 | 6,475.5 | 790.5 | 85.7 | 89.1 | 1.14 |
| Fishmeal 3 | 140 | 58 | 7,128.0 | 781.5 | 84.9 | 89.4 | 1.03 |
| Mean | 132 | 58 | 6,699.0 | 783.0 | 84.6 | 89.5 | 1.10 |
| Soy protein 1 | 142 | 62 | 6,604.5 | 829.5 | 77.5 | 89.3 | 1.11 |
| Soy protein 2 | 144 | 62 | 6,855.0 | 840.0 | 79.4 | 90.1 | 1.07 |
| Soy protein 3 | 121 | 59 | 6,109.5 | 790.5 | 84.5 | 89.7 | 1.21 |
| Mean | 136 | 61 | 6,523.5 | 820.5 | 80.5 | 98.7 | 1.13 |
The average feed-conversion ratio (FCR) for common carp fed the soy feed was 1.13. The average FCR for carp fed the diet with fishmeal was 1.10. Survival for common carp averaged 80.5 percent in the soy protein feed ponds and 84.6 percent in the ponds where fish were given feed with fishmeal.
Grass carp
Production of grass carp fingerlings with the test feeds was evaluated in a pond trial at the Taixing Fish Stock Farm in Taixing, Jiangsu Province. Grass carp fry of 0.6-gram size were stocked in six ponds at a density of 75,000 fish per ha together with silver carp fry at 15,000 per ha in early June 2007. As in the trial with common carp, all the grass carp were fed a 41 percent-protein, 11 percent-fat fry diet until they reached 2 to 3 grams. The fish were then weaned to the test diets and fed to satiation twice daily for 141 days.
Fish performance
There were no significant (P > 0.05) differences in grass carp fingerling growth, harvest biomass, feed conversion or survival with the two feed treatments (Table 3). Grass carp fed the soy-supplemented feed reached an average weight of 67.2 grams, while the carp given feed with fishmeal grew on average to 59.9 grams. Harvested biomass averaged 3,612 kg/ha and 3,545 kg/ha for grass carp fed the test feeds. An additional 1,139 kg/ha of silver carp were produced in each of the ponds that received the soy feed, while 996 kg/ha of silver carp were produced in the ponds that received the fishmeal-based feed.
Cremer, Performance of grass carp and silver carp fingerlings, Table 3
| Pond/Feed Treatment | Harvest Weight (g) Grass Carp | Harvest Weight (g) Silver Carp | Production (kg/mu) Grass Carp | Production (kg/mu) Silver Carp | Survival (%) Grass Carp | Survival (%) Silver Carp | Feed-Conversion Ratio |
|---|---|---|---|---|---|---|---|
| Fishmeal 1 | 60.3 | 69.0 | 3,600.0 | 961.5 | 79.6 | 93.5 | 1.13 |
| Fishmeal 2 | 59.2 | 69.0 | 3,583.5 | 988.5 | 80.7 | 95.1 | 1.14 |
| Fishmeal 3 | 60.1 | 74.0 | 3,450.0 | 1,036.5 | 76.5 | 94.0 | 1.03 |
| Mean | 59.9 | 70.0 | 3,544.5 | 996.0 | 78.9 | 94.2 | 1.10 |
| Soy protein 1 | 71.7 | 83.0 | 3,621.0 | 1,240.5 | 67.3 | 92.1 | 1.11 |
| Soy protein 2 | 69.3 | 74.0 | 3,675.0 | 1,096.5 | 70.7 | 90.9 | 1.07 |
| Soy protein 3 | 60.6 | 71.0 | 3,538.5 | 1.056.0 | 77.9 | 93.2 | 1.21 |
| Mean | 67.2 | 76.0 | 3,612.0 | 1,131.0 | 72.0 | 92.0 | 1.13 |
The average FCR for grass carp given soy protein feed was 1.06. Average FCR for the fish fed the fishmeal feed was 1.08. The average survival rates for grass carp were 72 and 79 percent in the ponds tested.
Tilapia
Production of tilapia fingerlings on the two test feeds was evaluated in a 79-day cage trial at Wenchang Reservoir in Wenchang, Haikou, Hainan Province. The trial was conducted in cooperation with the Hainan Fish Breeding Center of the Beijing Municipal Fishery Extension Center. At a size of 3 grams, monosex GIFT strain fish produced at the Hainan center were stocked into 12 4-cubic-meter cages at a density of 12,000 fish per cage in late May 2007.
Tilapia in four of the cages were fed the fishmeal-based feed twice daily. Tilapia in another four cages received the soy concentrate feed twice daily. Fish in the final four cages were fed the soy-supplemented diet six times daily. Tilapia in the four replicate cages of each feed treatment received an identical amount of feed each day and at each feeding.
Fish performance
There was no significant (P > 0.05) difference in tilapia performance with the two fingerling diets or feeding frequencies. Tilapia fed the fishmeal control diet twice daily grew to an average weight of 60.2 g. Those that received the diet with soy concentrate twice daily reached an average of 61.3 grams – the same average weight for the fish fed six times daily. Average FCR for the three groups were 1.13, 1.11 and 1.18, respectively, for the three groups.
The average survival rate for tilapia in all cages was a low 50 to 53 percent due to disease. The test results were therefore deemed inconclusive. The study will be repeated to verify the results.
Tilapia protein retention, utilization
A parallel study to the tilapia fingerling study in Hainan was conducted at the Aquaculture Nutrition and Feed Lab of the Feed Research Institute of the Chinese Academy of Agricultural Sciences (CAAS) in Beijing to identify if there were differences in protein utilization and deposition efficiencies with the fishmeal- and soy concentrate-based feeds.
Using the same tilapia stock as the Hainan trial, the CAAS study evaluated growth, feed utilization and body composition with the fishmeal-based diet fed twice daily, the soy concentrate feed with supplemental methionine fed twice daily, the soy feed with methionine fed six times per day, and the soy protein feed without supplemental methionine given six times per day. Evaluations were made of tilapia feed intake, specific growth rate, nitrogen retention efficiency, hepatosomatic index and other parameters.
The eight-week study was conducted in 260-l indoor fiberglass tanks with a recirculating water system. Fish fed twice daily were given access to the feed for one hour, after which uneaten feed was collected, dried and weighed for calculating feed consumption. The same procedure was followed for fish fed six times daily, except access to the feed was restricted to 40 minutes.
The best overall results were obtained with the fish fed the fishmeal diet twice daily and the treatment that used the soy protein-based diet with methionine fed six times per day. There was no significant (P > 0.05) difference between the two treatments for all factors except protein efficiency ratio, which was significantly better for the fishmeal diet.
With values of 0.95 and 0.97, respectively, these two treatments yielded significantly (P < 0.05) better feed conversion than the other treatments. Other factors varied by significance between the four feed treatments. There were no significant (P > 0.05) differences in condition factor and visceral somatic index among all the treatments.
Channel catfish
Production of channel catfish fingerlings fed the standard and test diets was evaluated in a pond trial at the Wanan Fishery Bureau Demonstration Fish Farm in Wanan County, Jiangxi Province. Channel catfish of 2-gram size were stocked in six ponds at a density of 135,000 fish/ha with 15,000 silver carp fry/ha in July 2007. Catfish in three of the ponds were fed the fishmeal-based feed to satiation for 122 days, while catfish in the other ponds received the feed with soy protein concentrate for the same duration.
Fish performance
Catfish growth, production and FCR were all better with the fishmeal diet. Fish fed the soy protein feed grew to an average weight of 52.3 grams, while channel catfish fed the other feed reached an average 61.5 grams. Fish biomass at harvest averaged 6,195 kg/ha in ponds that received the feed with soy protein concentrate feed and 6,975 kg/ha for ponds whose fish were fed the fishmeal-based feed. Each pond in the two treatments produced about 1,646 kg/ha and 1,610 kg/ha of silver carp, respectively.
The average FCR for channel catfish fed the soy protein feed was 1.21, compared to 1.07 for fish on the fishmeal diet. There was no significant difference in fish survival with the two feeds, with all treatments achieving over 80 percent survival.
(Editor’s Note: This article was originally published in the September/October 2008 print edition of the Global Aquaculture Advocate.)
Now that you've reached the end of the article ...
… please consider supporting GSA’s mission to advance responsible seafood practices through education, advocacy and third-party assurances. The Advocate aims to document the evolution of responsible seafood practices and share the expansive knowledge of our vast network of contributors.
By becoming a Global Seafood Alliance member, you’re ensuring that all of the pre-competitive work we do through member benefits, resources and events can continue. Individual membership costs just $50 a year.
Not a GSA member? Join us.
Authors
-

American Soybean Association
International Marketing
China Aquaculture Program
U.S. Soybean Export Council
12125 Woodcrest Executive Drive
Suite 140
St. Louis, Missouri 63141 USA -
American Soybean Association
International Marketing
China Aquaculture Program
U.S. Soybean Export Council
12125 Woodcrest Executive Drive
Suite 140
St. Louis, Missouri 63141 USA -
American Soybean Association
International Marketing
China Aquaculture Program
U.S. Soybean Export Council
12125 Woodcrest Executive Drive
Suite 140
St. Louis, Missouri 63141 USA -
American Soybean Association
International Marketing
China Aquaculture Program
U.S. Soybean Export Council
12125 Woodcrest Executive Drive
Suite 140
St. Louis, Missouri 63141 USA
Related Posts
Intelligence
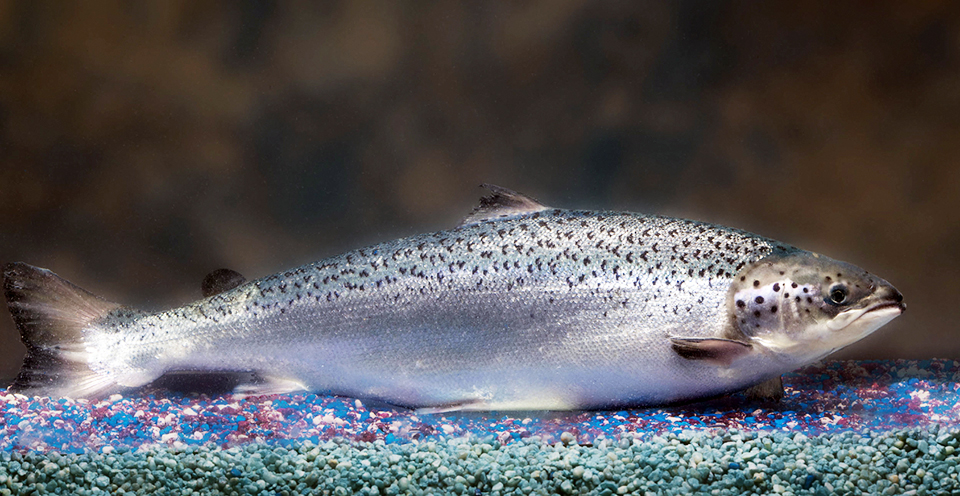
A brief look at genetically modified salmon
If approved by FDA, fast-growing genetically modified salmon will provide a safe and nutritious product similar to other farmed Atlantic salmon.
Aquafeeds
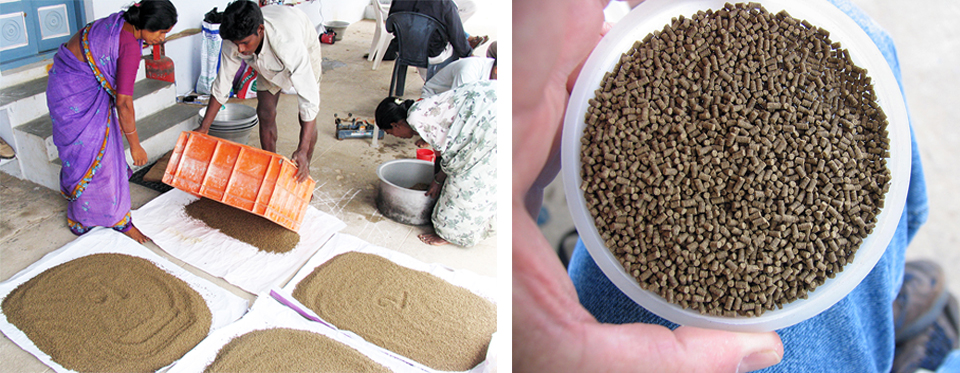
A look at India’s fish feed industry
India's fish-farming industry makes limited use of modern feeds, providing potential for the feed sector to grow. Commercial feeds are predominantly used for pangasius farming, followed by a rising popularity in carp culture.
Aquafeeds
A look at corn distillers dried grains with solubles
Corn distillers dried grains with solubles are an economical source of energy, protein and digestible phosphorus to reduce feed costs and fishmeal usage.
Aquafeeds
A look at phospholipids in aquafeeds
Phospholipids are the major constituents of cell membranes and are vital to the normal function of every cell and organ. The inclusion of phospholipids in aquafeeds ensures increased growth, better survival and stress resistance, and prevention of skeletal deformities of larval and juvenile stages of fish and shellfish species.