Study identifies maximum holding times for water samples
Samples should always be analyzed promptly
Information on water quality is increasingly used in making management decisions at aquaculture farms. Some farms establish water quality-monitoring programs as a voluntary means of demonstrating environmental stewardship. Other farms must monitor water quality to confirm compliance with effluent guidelines imposed by governments, lending agencies, and certification programs.
Some farms have laboratories where water quality analyses are done by employees, while others send water samples to commercial laboratories for analysis. Either way, samples can be held up to two days before analyses are initiated.
Samples usually are held on ice in insulated chests or refrigerated. The authors recently conducted a study to determine the maximum time that water samples can be stored at near-freezing temperatures without influencing the concentrations of common water quality variables. Their results are being considered for adoption within GAA’s Best Aquaculture Practices standards.
Sample study
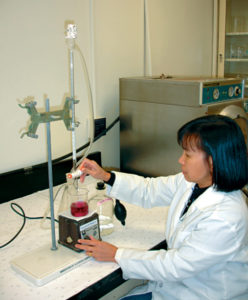
Surface water samples for the study were collected in plastic bottles from ponds at the Auburn University Fisheries Research Unit in Auburn, Alabama, USA, and held on ice in insulated chests. The samples were analyzed in the laboratory within 30 minutes after collection and again after six, 12, 24, 48 and 72 hours. Three samples of different concentration were analyzed for each variable. Triplicate determinations were performed for each variable and holding time.
A dozen common water quality variables were measured in the study. Dissolved oxygen was not included, for it is known to change rapidly during storage and should be measured in situ.
Results
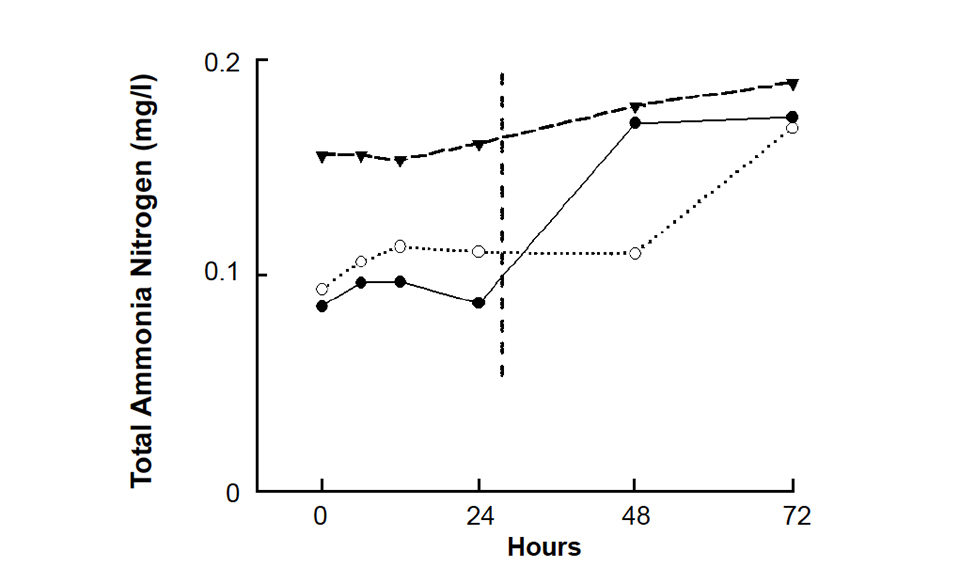
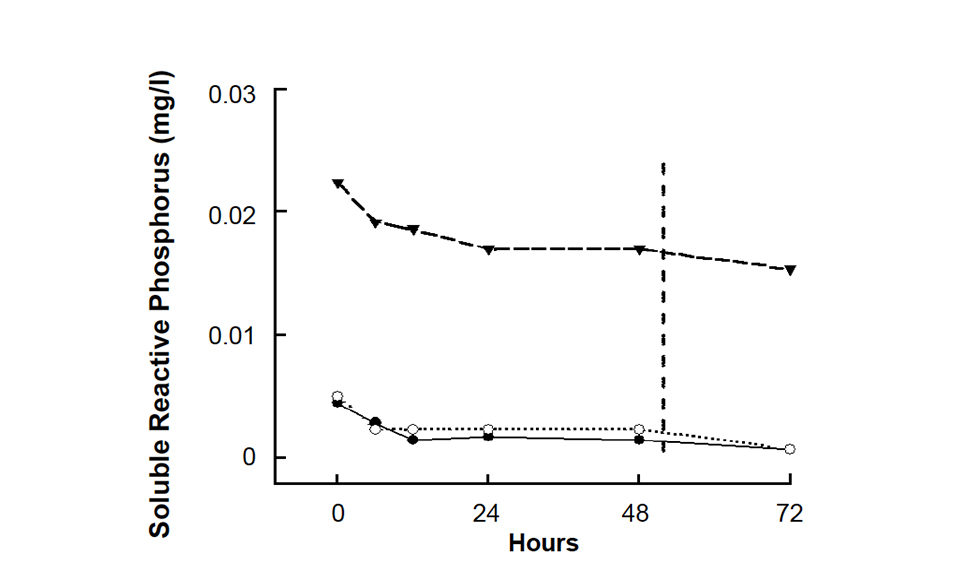
Results for several variables are summarized in Figs. 1-4. Variation among the sample replicates of each variable was small, so only mean values are plotted.
Differences in the mean concentrations of variables did not always occur after the same holding time for all samples, as illustrated for total ammonia nitrogen in Figure 1. Samples with the lowest and highest concentrations remained unchanged for 24 hours, but the sample of intermediate concentration did not change until after 48 hours.
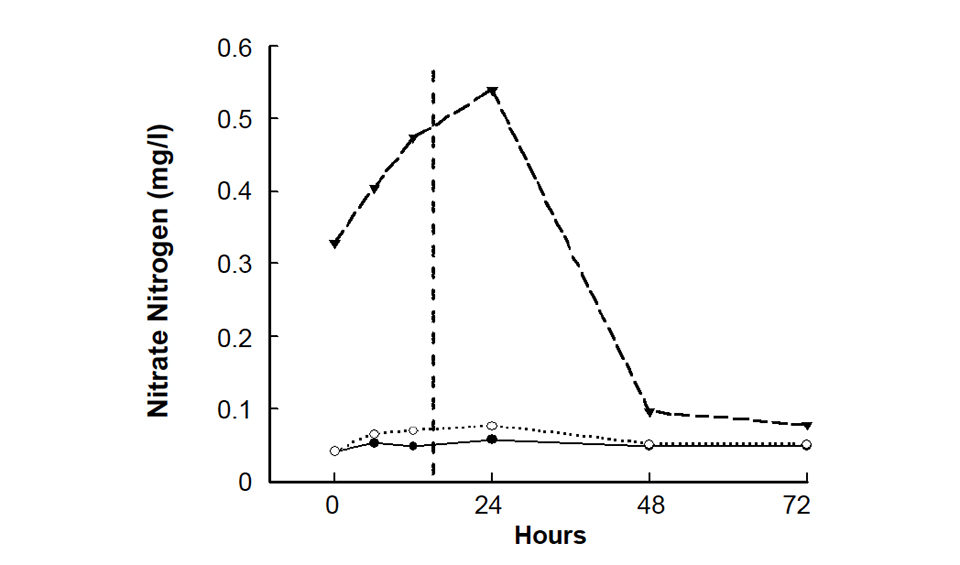
The concentrations of variables also exhibited different trends in change. Some decreased over time, some increased, and some increased and then decreased. In the case of nitrate nitrogen, the mean concentrations did not differ between the initial and six-hour samples, but after 12 and 24 hours were higher than those of the initial samples (Fig. 2). Concentration declined after 24 hours, but in one sample, the 48- and 72-hour values did not differ from the initial and six-hour ones.
Recommended holding times
When conducting water quality monitoring, investigators do not know the concentrations of water quality variables at the time of sampling. Therefore, for each variable, the time the first difference occurred in any of the samples was noted. The dotted vertical lines in Figs. 1-4, which mark the time after which changes in concentration of the variables initially occurred, indicate the recommended maximum holding times for the variables.
For example, in two samples, the first difference in total ammonia nitrogen concentration was observed after a holding time of about 24 hours (Fig. 1). In the other sample, the total ammonia nitrogen concentration was stable for 48 hours. Nevertheless, 24 hours was taken as the maximum recommended holding time.
Differences in nitrate nitrogen concentration first occurred in samples held longer than six hours (Fig. 2). The fact that one sample increased in nitrate concentration and then declined to the initial level after 48 hours does not justify holding samples for 48 hours before doing nitrate analyses. The nitrate concentration was declining because of uptake by bacteria and algae in the sample, and there is no assurance that all samples would decline to the initial concentration after 48 hours.
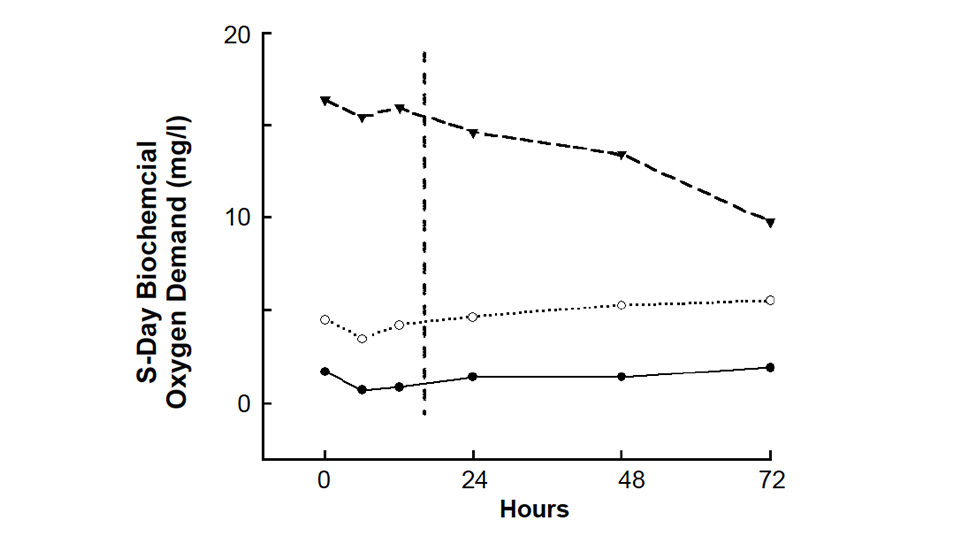
Recommended holding times for these and other variables are summarized in Table 1. Sample storage was limited to 72 hours because this was considered adequate time for transporting samples to a laboratory and initiating analyses. Variables such as chloride concentration, total suspended solids, turbidity, total alkalinity, and total hardness, which were stable for 72 hours, likely could be held longer, but samples should always be analyzed promptly.
Boyd, Recommended holding times, Table 1
| Variable | Time (hours) |
|---|---|
| pH | Analyze on site |
| Dissolved oxygen site | Analyze on site |
| Total phosphorus | 12 |
| Total nitrogen | 12 |
| Nitrate nitrogen | 12 |
| 5-day biochemical oxygen demand | 12 |
| Total ammonia nitrogen | 24 |
| Soluble reactive phosphorus | 48 |
| Chloride | 72 |
| Total suspended solids | 72 |
| Turbidity | 72 |
| Total alkalinity | 72 |
| Total hardness | 72 |
Study data revealed that pH readings taken after six hours can be different than initial readings. Without further study in which pH is measured at more frequent intervals during storage, it is suggested that pH should be measured in situ and samples not held on ice.
(Editor’s Note: This article was originally published in the November/December 2006 print edition of the Global Aquaculture Advocate.)
Now that you've reached the end of the article ...
… please consider supporting GSA’s mission to advance responsible seafood practices through education, advocacy and third-party assurances. The Advocate aims to document the evolution of responsible seafood practices and share the expansive knowledge of our vast network of contributors.
By becoming a Global Seafood Alliance member, you’re ensuring that all of the pre-competitive work we do through member benefits, resources and events can continue. Individual membership costs just $50 a year.
Not a GSA member? Join us.
Authors
-

Department of Fisheries and Allied Aquacultures
Auburn University, Alabama 36849 USA -

Department of Fisheries and Allied Aquacultures
Auburn University, Alabama 36849 USA
Related Posts
Health & Welfare
A study of Zoea-2 Syndrome in hatcheries in India, part 1
Indian shrimp hatcheries have experienced larval mortality in the zoea-2 stage, with molt deterioration and resulting in heavy mortality. Authors investigated the problem holistically.
Innovation & Investment
AI platform delivers data to fish and shrimp farmers
XpertSea does more than count fish. It uses AI and computer vision to calculate growth rates and optimal harvest dates to improve aquaculture efficiency.
Responsibility
Accuracy of custom water analyses varies
The reliability of trace element analyses reported by custom laboratories cannot be checked by simple techniques, and results may not always be accurate. One should check the reliability of major ion analyses by determining the charge balance and comparing the measured total ion concentration with the total ion concentration estimated from conductivity.
Responsibility
Effluent effects from aquaculture ponds
In general, lower-intensity pond and cage farming tends to discharge higher overall pollution loads in farm effluents than closed aquaculture systems.