Survey: Salmon can gain a stronger position
U.S., U.K., German and French consumers’ perceptions of convenience and health improve, but value still a concern

Farmed salmon has experienced high market prices in recent years. But how strong is the position of salmon among consumers in major markets? Are the high prices just a consequence of the inability to increase salmon production globally?
It is useful for the salmon sector to know more about the position of salmon in the minds of consumers compared to other proteins. We conducted a survey of 8,000 consumers in four countries – the United States, the United Kingdom, Germany and France – in 2015 to learn more about perceptions and consumption habits. The project was funded by The Norwegian Seafood Research Fund (FHF) and the Norwegian Seafood Council. This article presents some findings from the significant dataset collected from 2,000 consumers in each country.
Position of salmon
“Position” refers here to the consumer perception of a product relative to the perception of competing products. Consumer’s demand or willingness to pay for the product is to a large extent a function of its position. Here, we analyze the position of “generic” salmon against generic agricultural competitors – chicken, beef and pork.
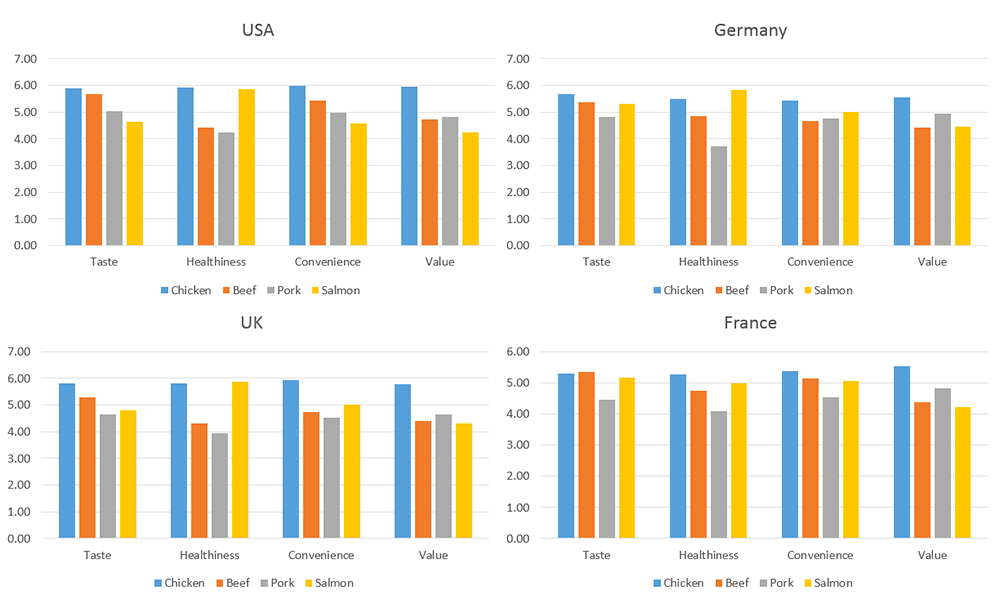
Fig. 1 shows the perceptions of salmon and meat from agriculture in terms of taste, healthiness, convenience and value for money. Consumers were asked to rate salmon, chicken, pork and beef on a scale from 1 (low) to 7 (high). The score for each dimension is the country average. For a product category (e.g. salmon), the average position is stronger the higher the value in the spider diagram.
In all four countries, chicken has generally the strongest position when we assess all dimensions and assign them the same weight. The general position of salmon tends to be at the level of pork and beef. Salmon has the weakest position in the United States, with a relatively stronger position in the U.K. and Germany.
Healthy, but so is chicken
Among the four dimensions rated by consumers in Fig. 1, salmon clearly has its strongest position in terms of perceived healthiness. Overall, salmon beats the other species on healthiness, but chicken follows salmon closely. In statistical terms, the difference between salmon and chicken on perceived healthiness is so small that it can be considered a tie. In the U.K. and Germany, salmon is ranked first on healthiness followed by chicken as No. 2 in both countries. In the United States and France, it is the other way around, with chicken being perceived as the healthiest one, and salmon taking the second place. The big loser when it comes to healthiness perceptions is pork, which is ranked at the bottom in all four countries. One may well ask what is behind these healthiness ratings, which we will explore later in the article.
Taste buds prefer chicken and beef
Salmon overall has a similar rating to pork on taste. But salmon is far behind chicken and beef, the clear winners of consumers’ taste buds. Chicken is preferred by Americans, Britons and Germans, followed by beef. In France, there is a virtual tie between beef and chicken. Americans rate salmon lowest on taste of all the four countries.
It is natural to ask to what extent this represents inherent differences between the taste buds of Americans and the other countries, or to what extent there are opportunities for manipulating the flavor of salmon products in processing and cooking stages to improve taste perceptions. One of the co-authors has anecdotal evidence from the United States that overcooking of salmon tends to affect the flavor of salmon in a significantly negative direction.
Chicken is king of convenience
Salmon is in a similar position as beef when it comes to consumers’ convenience perceptions, and it beats pork overall. In the U.K. and Germany, salmon beats both beef and pork, while it only beats pork in France, and is a clear loser among U.S. consumers. But chicken is the king of convenience in all countries, particularly so in the United States and the U.K. It can be argued that salmon has made great strides in several aspects of convenience over time – general availability in shops and foodservice, product differentiation and increased availability.
Salmon – the value loser
Salmon gets the lowest rating on value for money, also relative to the proteins from agriculture. In three of the four countries sampled, salmon is at the bottom of the ranking, while in Germany consumers rate salmon and beef as very similar. Beef is generally also perceived to provide low value for money. In all four countries, chicken is the value winner, followed by pork. Value for money can be interpreted as the ratio between the utility consumers derive from a product in terms of taste, healthiness, convenience, etc. and the price of the product. Salmon is generally expensive relative to chicken and pork in these markets, and this contributes to salmon’s weak value rating.
Development over time
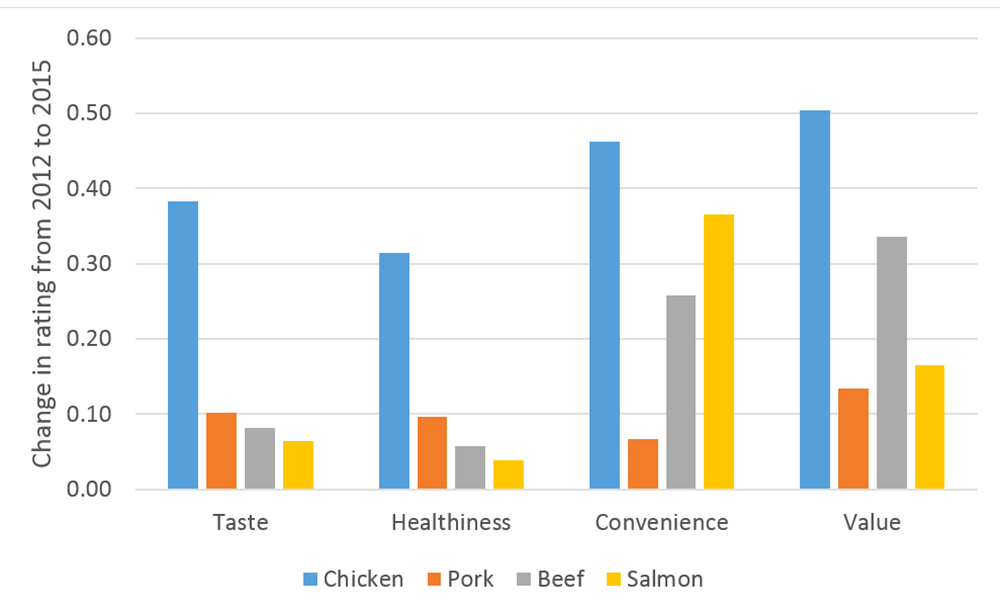
What has happened with salmon’s position among consumers over time? We asked the same questions to households in the U.K., France and Germany in 2012. Fig. 2 shows the development in position of salmon and chicken when we pool these countries together. For both chicken and salmon, the average rating increased in all dimensions from 2012 to 2015. However, chicken experienced a greater increase than salmon in general, implying that the position of chicken relative to salmon is even stronger than before.

Fig. 3 shows the change in average rating of all four proteins surveyed here from 2012 to 2015. A positive value indicates that the average rating has increased from 2012 to 2015. We see that for all proteins and all dimensions there has been a positive development. However, salmon does not stand out. It is chicken that exhibits the most positive development. For salmon consumers’ convenience, perception has developed most positively, but again is beaten by chicken. It has achieved the same average rating as chicken had in 2012. The question is if salmon – through further product development, increased product differentiation, distribution channel development, etc. – can continue to strengthen its position in the convenience dimension.
Healthfulness perceptions
We will now examine what perceptions consumers about the health effects of a regular consumption of salmon or chicken. Consumers were presented different statements about health effects of a regular consumption and asked if they agreed, were neutral or disagreed on a five-point scale.
Fig. 4 shows the average score for chicken and salmon in each of the four countries. A negative average value means that the consumers on average disagree with the statement, a zero value means that they are neutral, and a positive value means that they agree with the statement. Overall, Fig. 4 indicates that salmon is perceived as having more beneficial health effects than chicken. To show this more clearly, we present the responses in another way in the next figure.
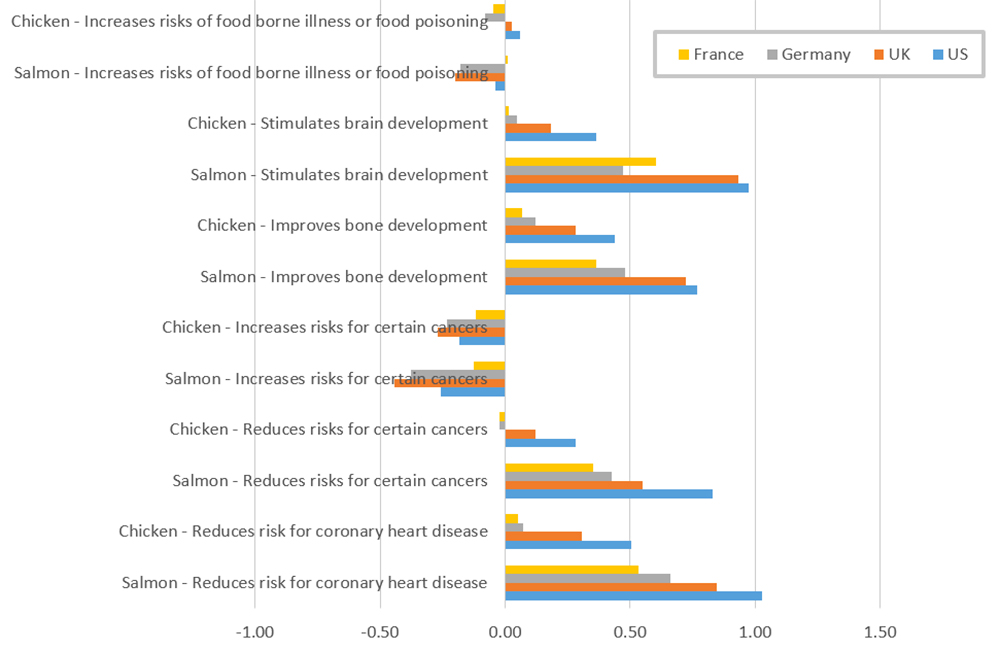
Fig. 5 presents the difference between the average rating for salmon and chicken. In other words, we take the difference between the salmon rating and the chicken rating. If the difference is positive, consumers agree more strongly on the health effect statements for salmon than for chicken, and vice-versa for negative values. Fig. 5 shows that salmon generally is perceived as having more beneficial effects than chicken on brain development, bone development, cancer risks and coronary heart disease risk. On food safety, salmon and chicken are perceived as equal.
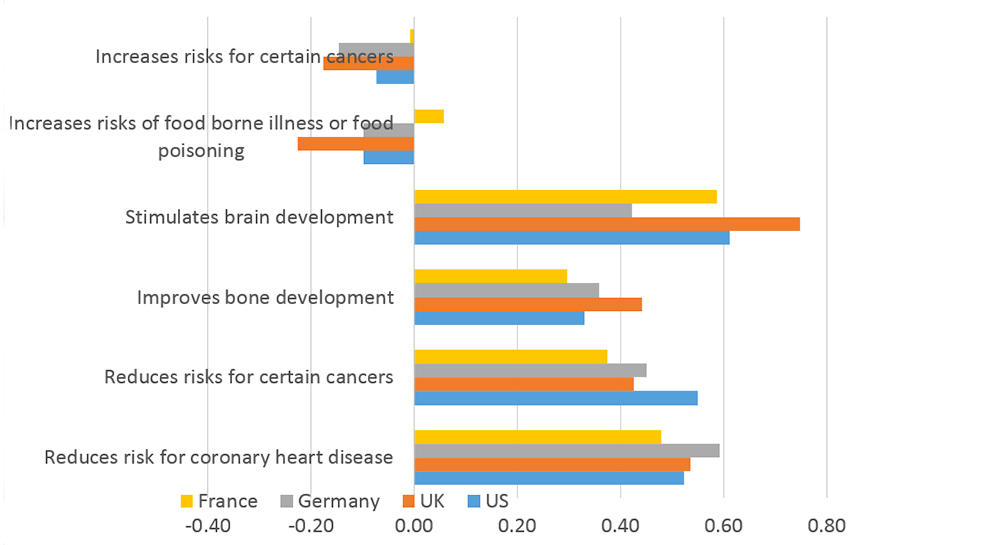
Earlier we have seen that consumers in general perceive chicken and salmon as being equally healthy. But when we break “healthfulness” down into the above more specific health effects, we see that salmon is actually perceived as being superior to chicken.
Consumption frequency
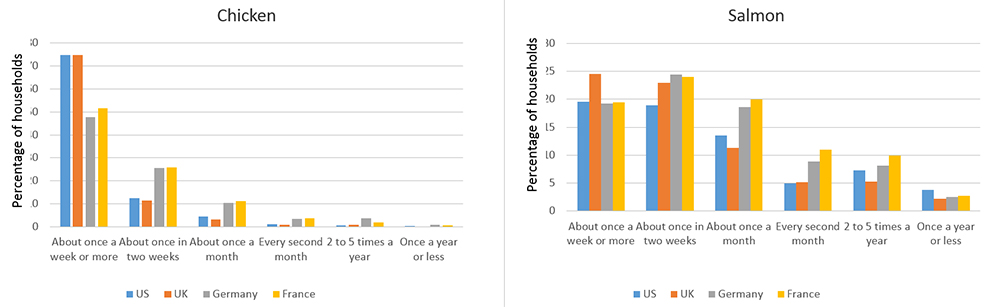
What ultimately matters for the salmon farming sector is consumption. We have asked consumers how often they consume chicken and salmon at home, as shown in Fig. 6. As expected, salmon consumption frequencies are generally well below those for chicken. On average for the four countries, 62 percent of the households eat chicken at least once a week, versus 20 percent for salmon. Furthermore, 81 percent of the households eat chicken at least once every two weeks, versus 43 percent for salmon. What these figures of course do not tell us is the consumption volume and value.
We see significant differences in consumption frequencies between countries. The United States and the United Kingdom have much higher chicken consumption frequencies than France and Germany. Salmon consumption frequencies are more similar across countries. In the U.K., 25 percent of consumers eat salmon at home at least once a week, and 47 percent eat salmon at least once every two weeks. In the United States, Germany and France, around 20 percent of households consume salmon at home at least once a week. Around 44 percent of households in Germany and France eat salmon at least once every two weeks, with U.S. households at a slightly lower level of 39 percent.
Conclusions and perspectives
Our study shows that consumers’ perceptions of salmon are still lagging behind those for chicken in important dimensions. Salmon is doing relatively better compared to beef and pork. In terms of value for money, salmon is clearly beaten by chicken, something which is probably also due to the high salmon prices in recent years.
Moreover, salmon has not improved its relative position when we compare our 2015 results to those from the 2012 study. Salmon has improved its rating in the convenience dimension, which may be explained by increased distribution and product differentiation. But chicken also experienced an increase in its convenience rating.
The findings from this study have potential implications for actions in salmon value chains – communication with professional buyers and consumers, product development and distribution through different channels. There is still much to learn from the much bigger and more mature chicken sector. It is relatively safe to argue, based on observations of other protein sectors and knowledge about the scope for improvement in the salmon sector, that salmon still has potential to gain a stronger position in the minds of consumers.
A more mature salmon sector should also be characterized by higher investments by companies in its own products, increasing product differentiation and branding that can strengthen the position of salmon among consumers with different preferences.
It may be important to reach consumers who are not so into food in general, who we call “low involvement consumers.” These are consumers who typically eat less salmon, and where improving the health perception can actually seem to increase the consumption [Yuko Onozaka, Håvard Hansen and Arne Sørvig (2014). Consumer Product Perceptions and Salmon Consumption Frequency: The Role of Heterogeneity Based on Food Lifestyle Segments, Marine Resource Economics, 29(4): 351-374]. Of course, it would be a challenge to reach these consumers, precisely because they are less interested in food.
Another question is the future division of labor between generic marketing of salmon and companies’ brand building efforts through communication, product development and development of distribution channels. This is one of the important discussions, which also includes what types of generic marketing investments can provide the highest returns.
A more mature salmon sector should also be characterized by higher investments by companies in its own products, increasing product differentiation and branding that can strengthen the position of salmon among consumers with different preferences.
Authors
-

Professor
The University of Stavanger
4036 Stavanger, Norway -

Associate Professor
The University of Stavanger
4036 Stavanger, Norway -

Ph.D. candidate
The University of Stavanger
4036 Stavanger, Norway
Related Posts
Intelligence
Consumer survey explores farmed, wild seafood perceptions
What do shoppers really think about farmed and wild seafood? Commissioned by The Fishin’ Co. and the Global Aquaculture Alliance, an extensive survey conducted earlier this year sought to determine the key drivers in consumers’ seafood purchasing habits and their perception of aquaculture.

Intelligence
Global finfish production review: Gradual growth
Recent surveys indicate that global finfish production has doubled over the last decade, but most of this growth happened in the first half of this period. Production is still growing but at slower pace than in recent years, and annual growth rates must increase to at least 7.2 percent to maintain the double-in-a-decade objective.

Intelligence
New normal in global nutrition?
The latest Global Nutrition Report indicates serious levels of both malnutrition and adult overweight and obesity. It is a major challenge, particularly among women and children. Seafood, including from aquaculture, can play a significant role in helping address this issue.

Intelligence
Off the Knife with Barton Seaver
In the second Off the Knife interview with chefs and foodservice professionals, Barton Seaver tells the Advocate that while restaurant employees shouldn’t have to recite sustainability science at tables, they can personalize their knowledge and effectively communicate the method behind the menu.

Intelligence
Survey: Food safety becoming Chinese consumers’ top priority
In a survey of more than 1,500 Chinese consumers, the authors studied their fresh food purchasing behavior and found food safety to be the top priority. These consumers are willing to pay more for safe, fresh food, and they’re paying attention to the details.