Thoughts on improving responsible aquaculture intervention efforts
Certification programs the best tool to assure a product is from responsible aquaculture
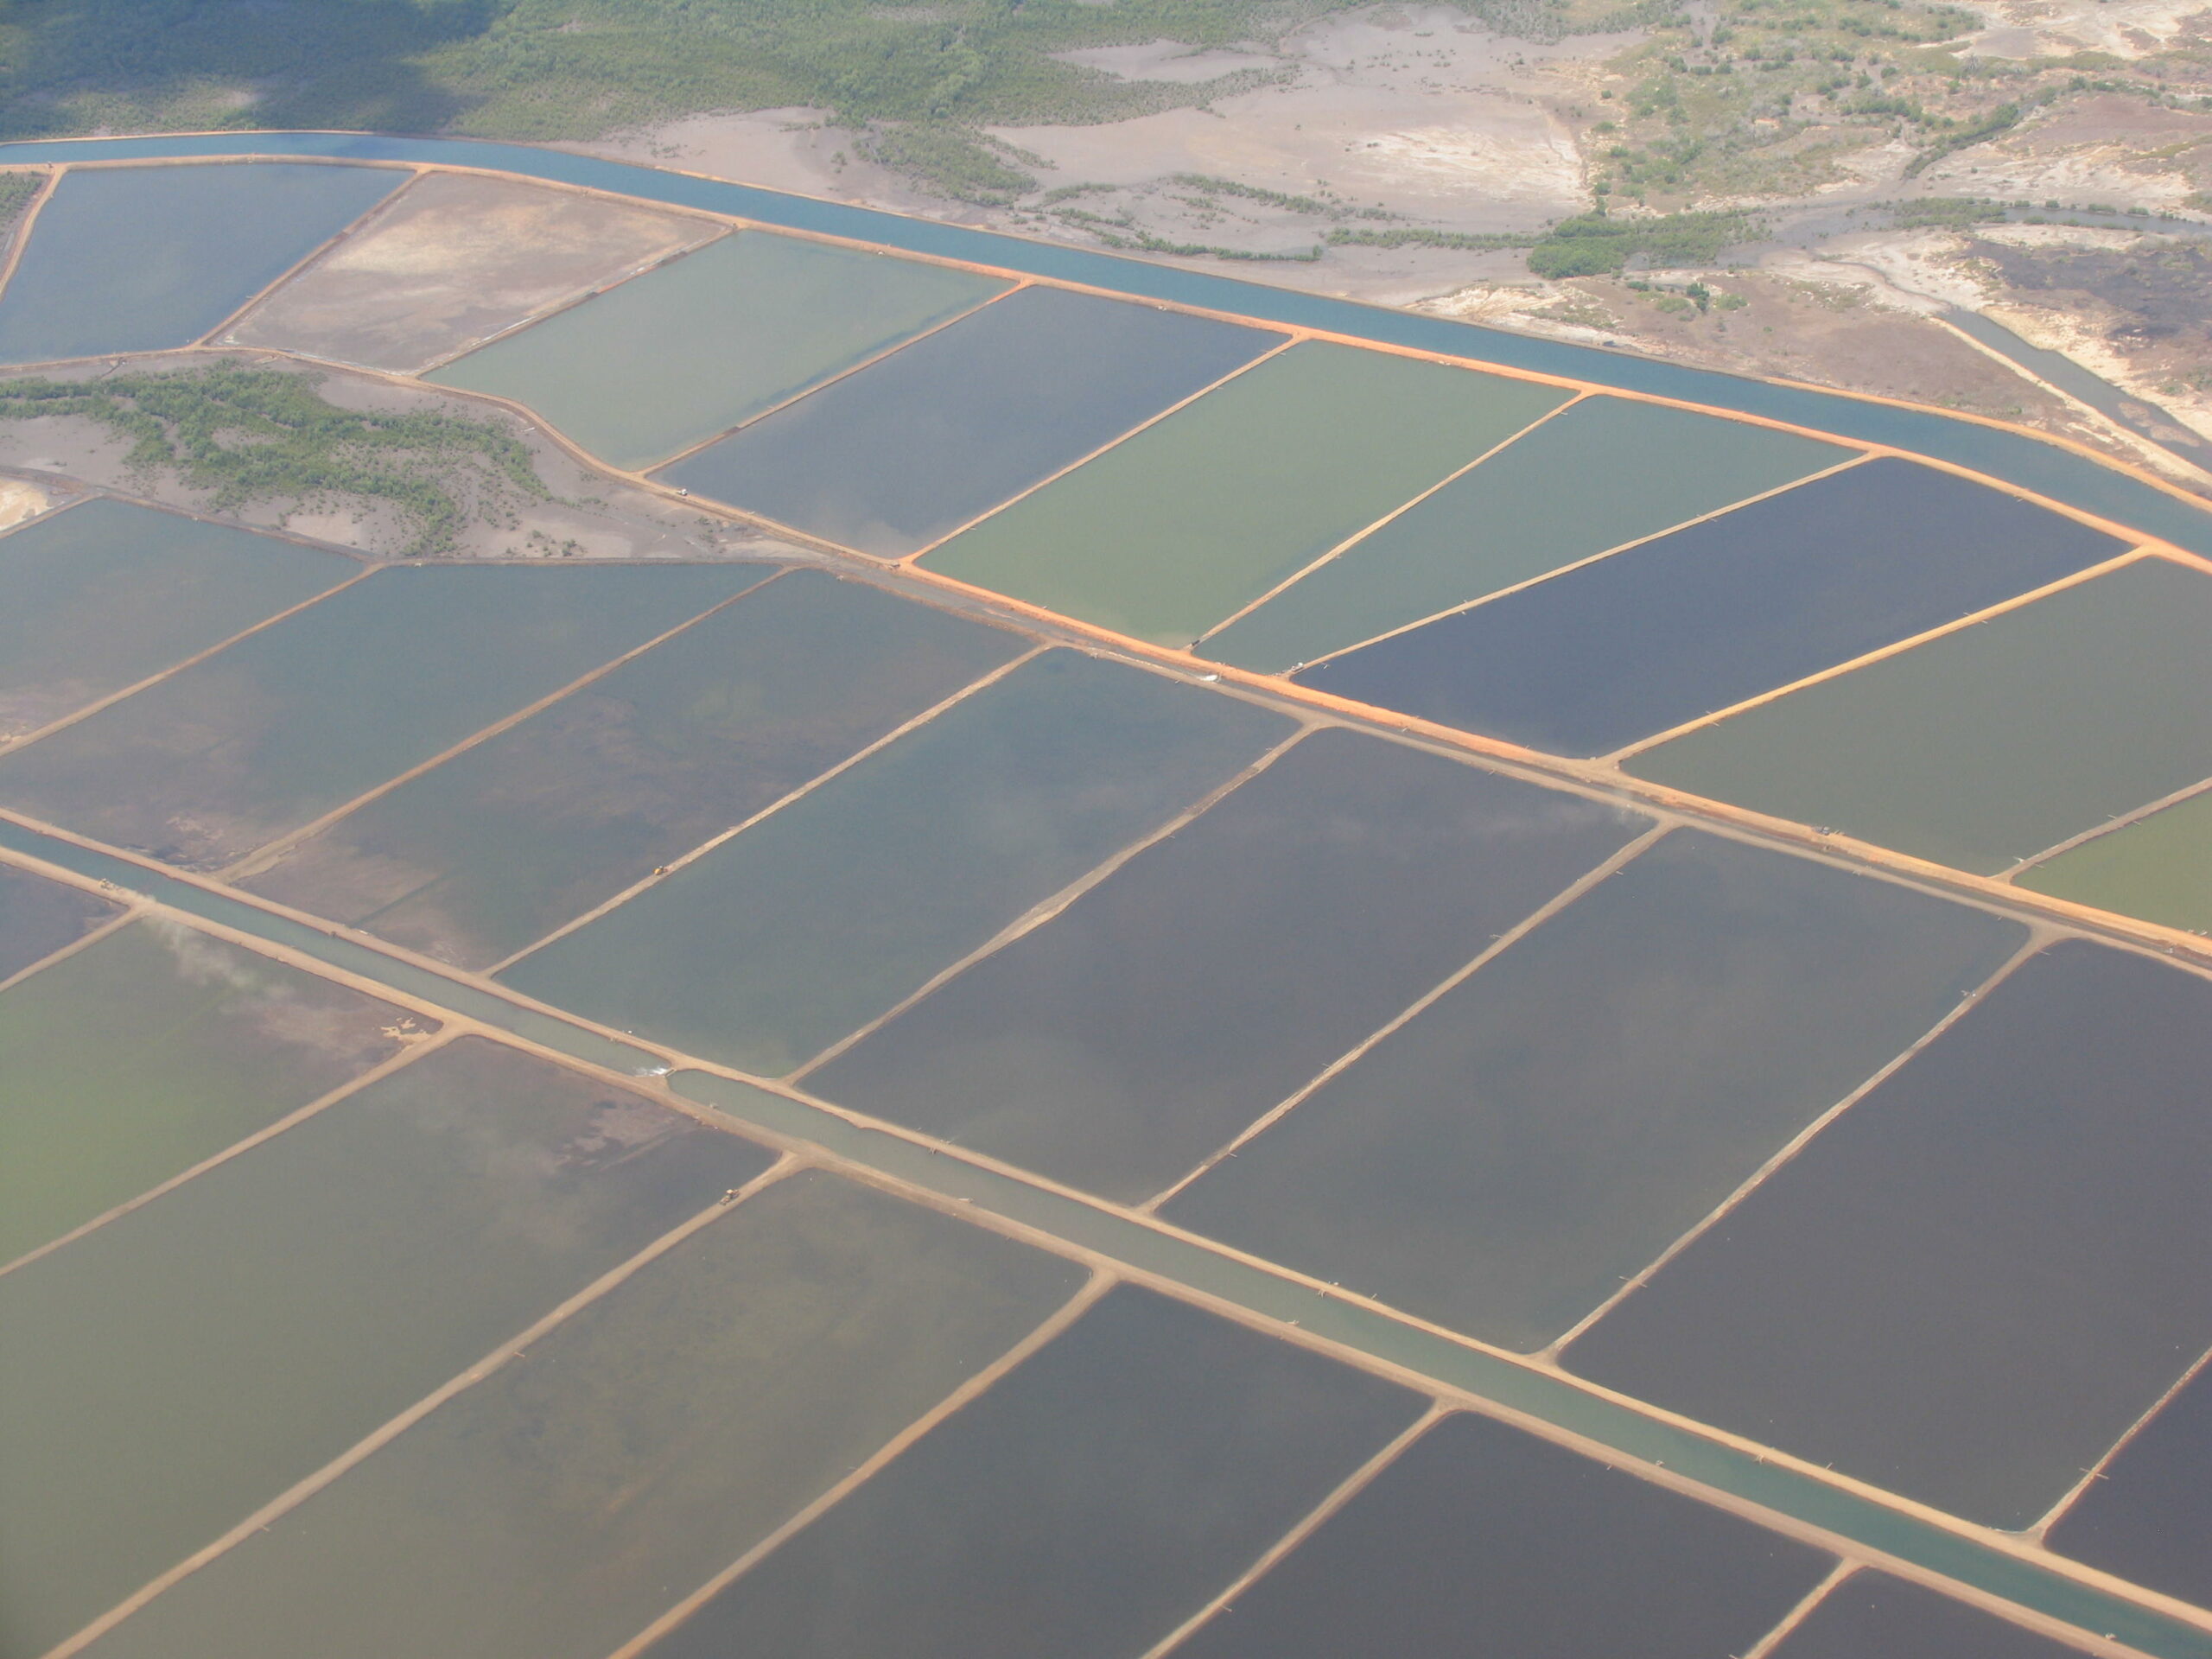
I have been involved in the responsible aquaculture movement since its beginning, and have tried to be objective and realistic. Of course no one is truly objective, but I do understand and sympathize with the concerns of both the aquaculture industry and the environmental community. As a result of recent participation in a project to collect data on production methods and resource use at 84 shrimp farms in Thailand and Vietnam, I feel compelled to make some comments on efforts towards more responsible aquaculture. The study provided direct insight on resource use efficiency at farms, and in turn, afforded indirect evidence of environmental performance as it relates to measurable results. The findings for shrimp aquaculture are indicative of resource use efficiency relationships in other types of aquaculture and bear directly upon efforts to make aquaculture more environmentally responsible.
Data from the shrimp farm survey pertained to nearly all aspects including farm size, layout, operational procedures, and production results. These data will be published soon in a peer-reviewed journal, and it will suffice at present to simply state that there was no single farm model for producing either Litopenaeus vannamei or Penaeus monodon in the two countries. Although a few shrimp farms in the sample for each country were similar, most were quite different from each other in layout, water management, operational inputs and performance.
Efficiency indicators
Five key indicators of efficiency (and environmentally-responsibility) are feed conversion ratio (FCR), land use (including land for feed ingredients), water use, energy use (including energy embodied in feed), and the fish in: fish out ratio. There was tremendous variation among farms for both species with respect to these indicators, as will be illustrated with results from L. vannamei farms.
The means and ranges in the values of the indicators (Table 1) were lower in Thailand than in Vietnam for FCR, land use, water use, and fish in: fish out ratios. Energy use was slightly lower in Vietnam than in Thailand. The lower FCR in Thailand was the result of better feed management, and this led to a lower fish in: fish out ratio in Thailand than in Vietnam. Higher production per hectare in Thailand than in Vietnam accounted for Thailand having lower land and water use values. More aeration per hectare was used in Thailand leading to greater energy use per tonne of shrimp production in this country than in Vietnam. There also was a large range among farms with respect to values for all five indicators in both countries.
| Thailand | Vietnam | |
|---|---|---|
| FCR | 1.33 (0.85 to 2.25) | 1.49 (1.2 to 2.2) |
| Land use (ha/ton shrimp) | 0.58 (0.26 to 0.68) | 1.06 (0.25 to 9.88) |
| Water use (cubic meters/ton shrimp) | 5,440 (2,000 to 21,000) | 15,100 (928 to 148,150) |
| Energy use (GJ/ton shrimp) | 50.6 (14.1 to 191.4) | 45.6 (16.0 to 364) |
| Fish in:fish out ratio | 1.22 (0.92 to 1.64) | 1.34 (0.70 to 2.30) |
Although the data in Table 1 are for shrimp aquaculture, the findings suggest that differences in performance indicators also would occur among countries for other types of aquaculture. Moreover, in a single country, there would be much variation among farms for each indicator, and the ranges in indicators would overlap among countries. The upshot is that the information used in determining the standards for certification programs and for making decisions about the relative performance of any type of aquaculture, both within and among countries, should be based on a large database for farms, their production methods and resource-use efficiency.
Improving aquaculture performance
The development of credible standards in certification programs and buyer purchasing policies have been based on research findings and the opinions of stakeholders with extensive knowledge of aquaculture – usually researchers, high-profile individuals, and successful producers. These experts typically shaped their opinions on information from research or from farms with which they had considerable knowledge. Large industry-wide, farm-level databases for individual species were not then or now available.
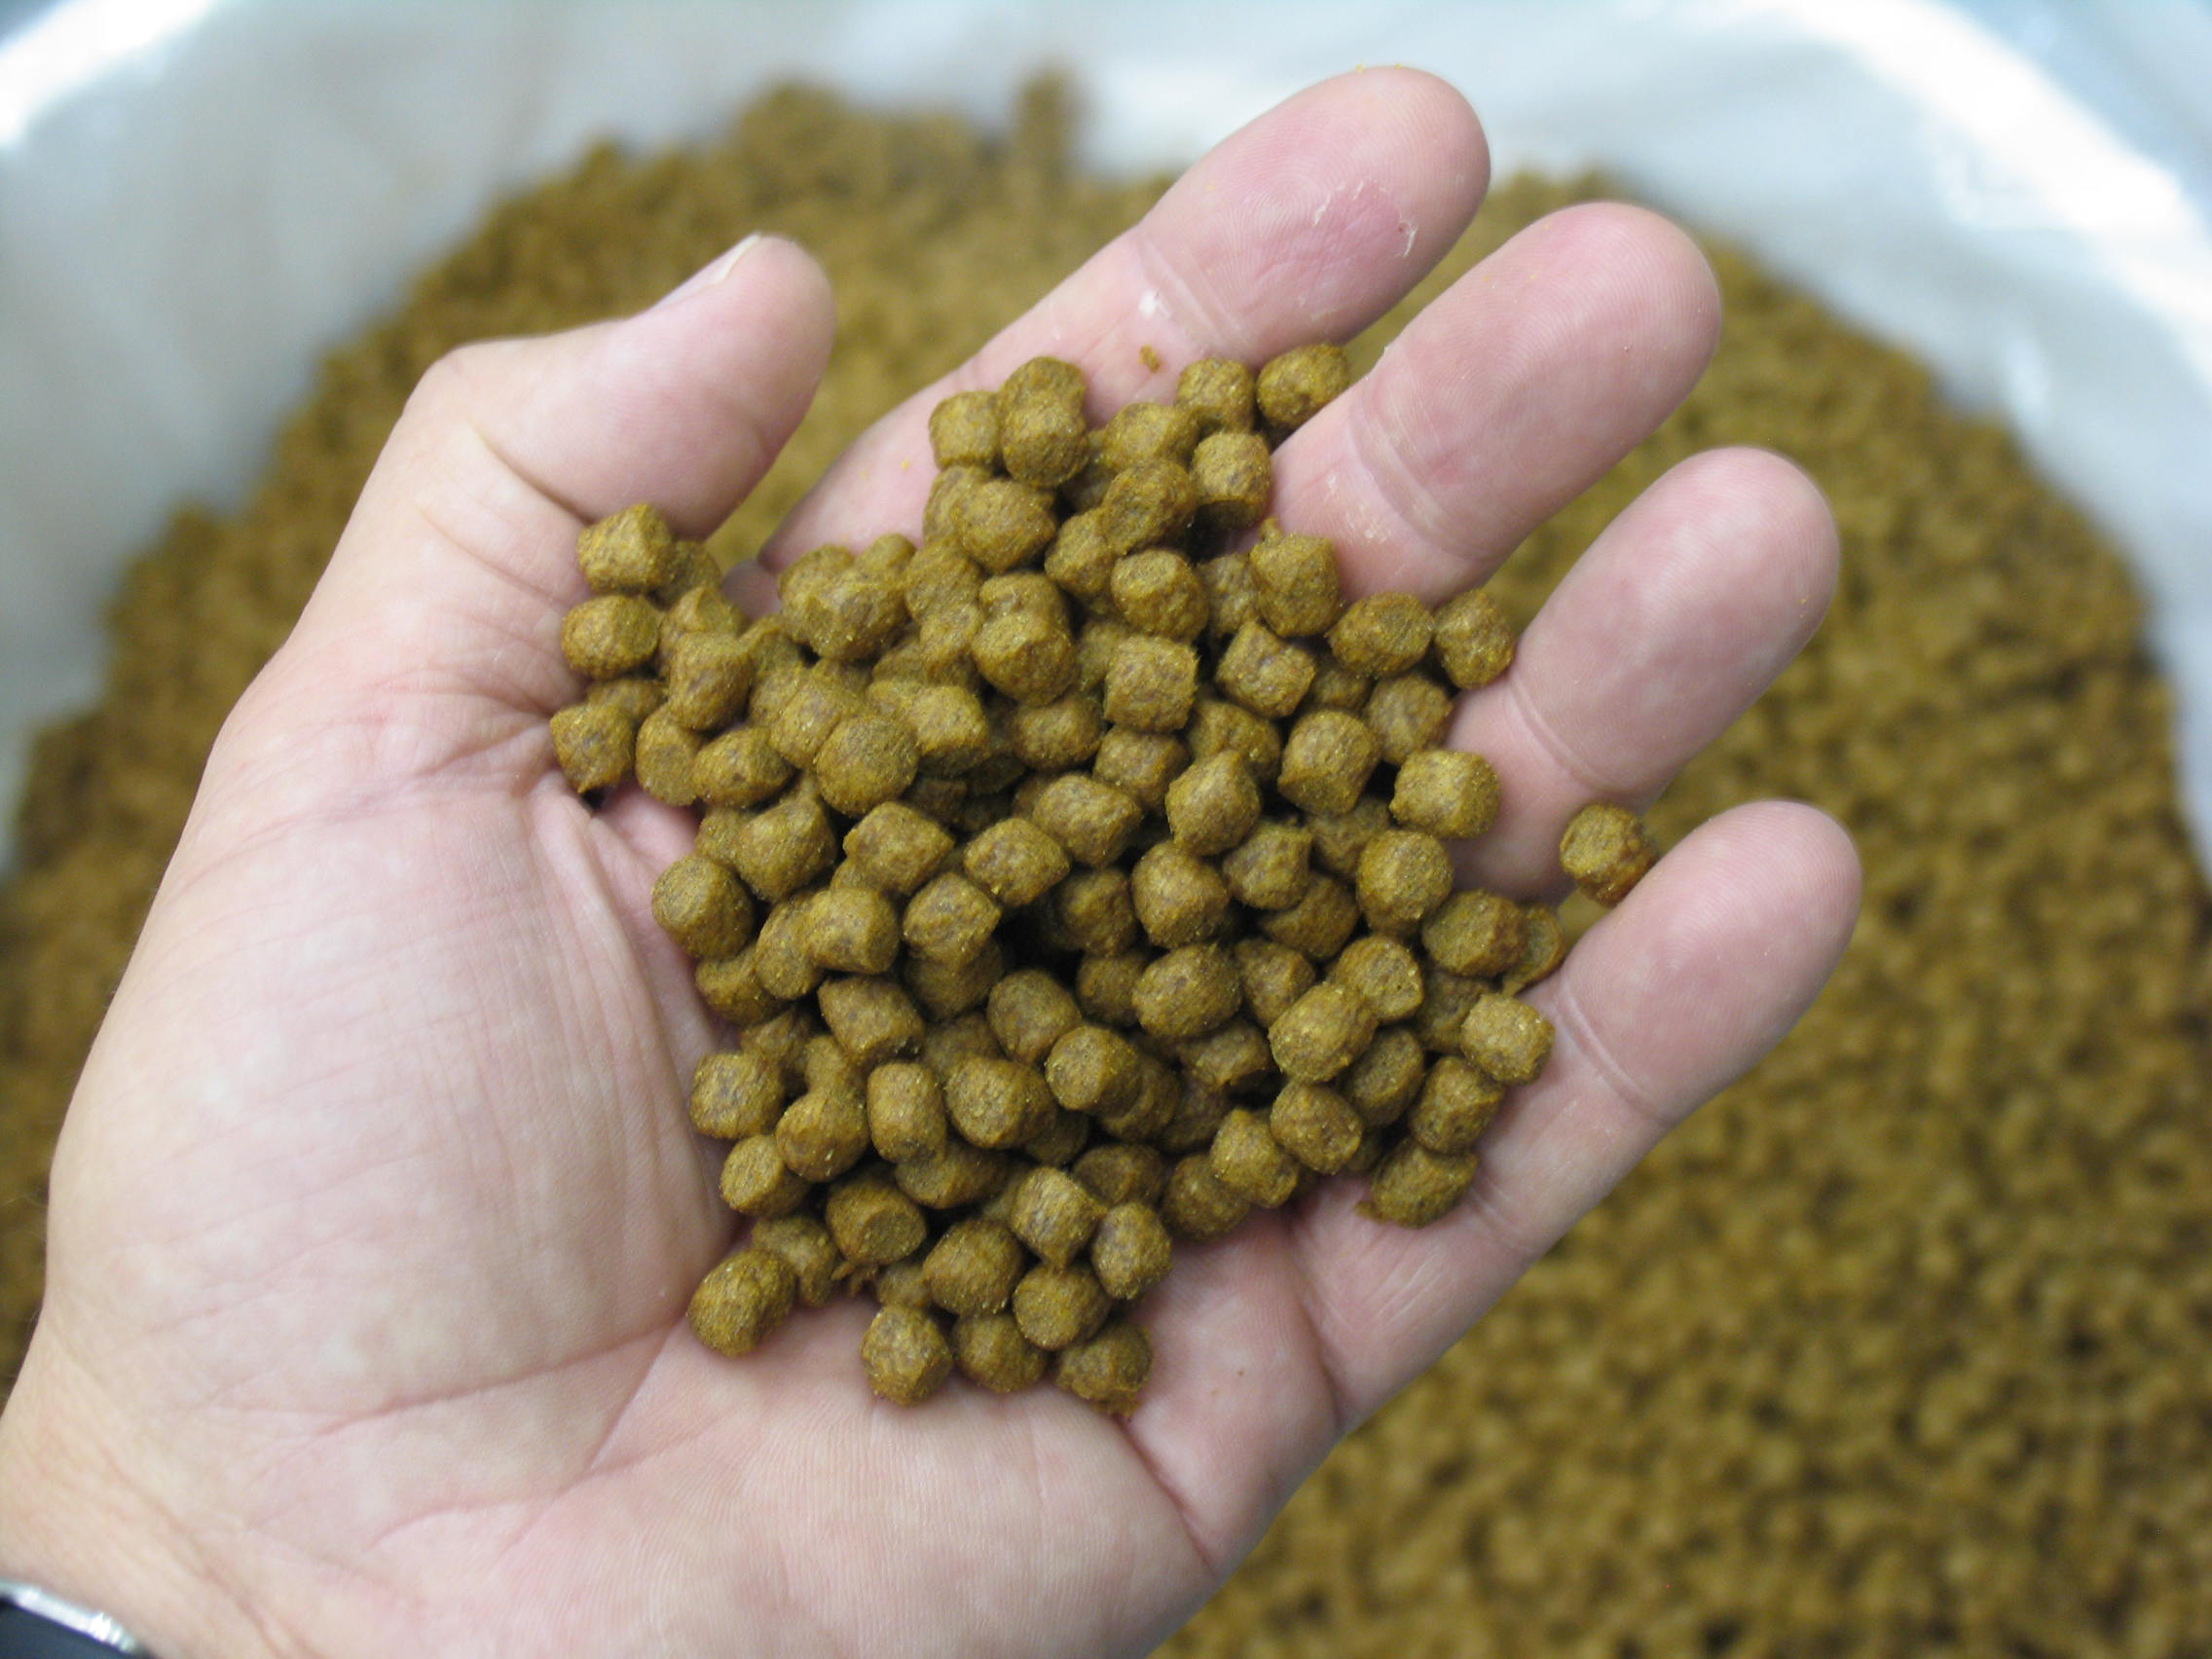
The FCR provides an example of how research data or data from a few farms may or may not be representative of the average and range of FCR across entire production areas. The FCR reported in research for L. vannamei typically ranges from 1.3-1.8. A study of inland-shrimp farming in the US indicated an average FCR by commercial farms of around 1.7, and the shrimp farms in Thailand and Vietnam tended to have FCR values within the range of those from research studies. Thus, the research data appear relatively reliable for these specific instances. In the case of channel catfish in the US, the FCR values obtained in research also usually are between 1.3 and 1.8. But, reference to USDA production statistics for feed use and fish processed revealed industry-wide FCR values of 2.54 in 2004 and 2.31 in 2014 – much higher than those typically obtained in research.
The results of the survey of shrimp farming in Thailand and Vietnam illustrate that our efforts at improving the performance of aquaculture should be based on extensive farm-level data. Such databases would allow us to ascertain the level of performance possible with existing production methods and technology. The data also would be helpful in improving standards in aquaculture certification programs and other responsible aquaculture efforts.
Seafood rating systems
Seafood rating systems are used by a number of organizations and major aquaria to make pocket-sized cards indicating which species are best (green) or good alternative (yellow) environmental choices as well as species to avoid (red). These cards are useful for wild fisheries products, because fisheries are extensive and have been rated as to the degree to which they are exploited. However, the use of these cards is problematic for aquaculture products, because the cards do not take into account of the great variation in farm performance within a country or among countries.
A product from a “red country” (avoid) may actually be produced at a farm performing at a high-level of environmental responsibility – even having acquired BAP, ASC or other certifications. On the other hand, a product from a green country (best choice) might be from a farm recently constructed in a mangrove habitat or from a farm that failed to comply with one or more other requirements for environmental stewardship.
The aquaculture rating systems do not encourage producers to improve their performance. For example, a shrimp producer in a “red country” has no incentive to improve because all aquaculture shrimp from the country is considered a bad environmental choice. Moreover, farmers tend not to be organized well enough to effectively work towards improving their performance in a country-wide effort to upgrade the rating of their product. In a “green country,” a “bad” producer need not devote any effort to improving performance, because the “green status” of the product is assured.
Information on U.S. and Canadian production plus the top-10 importing countries for shrimp and tilapia imports are arranged according to colors of a popular rating system (Table 2). The “green” portion shows no FDA rejections, and suggest that the green rating is reliable with respect to food safety. But the volume of green product is small and declining – in the case of shrimp and tilapia consumed in the US, the “green” volumes are 0.35 percent and 2.57 percent, respectively. The ratings seem too restricted to encourage producers to employ better practices. The main benefit of the ratings seems to be to “ease the minds” of discerning consumers.
| Species and ranking* | No. of countries | 2015 consumption (MT) | % increase in production (2014 to 2015) | No. of FDA import refusals |
|---|---|---|---|---|
| Shrimp (green) | 1 | 2,004 | -41 | 0 |
| Shrimp (yellow) | 2 | 100,415 | 67 | 3 |
| Shrimp (red) | 8 | 425,577 | 12 | 612 |
| Tilapia (green) | 3 | 11,551 | -38 | 0 |
| Tilapia (yellow) | 3 | 189,904 | 74 | 201 |
| Tilapia (red) | 6 | 29,989 | 139 | 10 |
Some of the rating programs also maintains apps which gives standards by which a facility in a red country could achieve yellow or green classification. Moreover, the categories ranked in some of these apps include ratings for specific production systems (ponds, raceways, net pens, recirculating systems). But, because of a lack of traceability, there is no guarantee that this information can be conveyed to the consumer by the seafood vendor. At present, a US consumer using one of these rating cards or apps can only discern the country of origin of a product and whether it was farmed or wild caught. Neither is informative of the environmental impact of the farm that produced a particular seafood product.
Perspectives
Responsible aquaculture programs ideally are “works in progress,” and continuous efforts should be made to improve them. It is not easy to educate those desiring to learn the fundamentals of aquaculture production, and while the intent of the rating programs is good, it remains to be seen if attempting to educate consumers about their seafood choices can be done in a manner which generalizes impact across aggregates of farms.
Certification programs presently are our best tool in assuring that a product is from responsible aquaculture. These programs have farm-level inspections for compliance with standards, traceability, and a label to inform buyers. Nevertheless, certification is burdened by many superfluous requirements. Simplification of certification programs by focusing primarily on the major issues would be a great improvement. This effort would, however, require the collection of vast amounts of farm-level data.
Author
-

School of Fisheries, Aquaculture and Aquatic Sciences
Auburn University, AL 36830 USA
Related Posts
Responsibility
Calcium and magnesium use in aquaculture
Aquatic plants and animals get the essential nutrients calcium and magnesium from water and food. Calcium concentrations impact the hydration and development of eggs in a hatchery, where calcium carbonate precipitation can be troublesome.
Responsibility
Efficiency of mechanical aeration
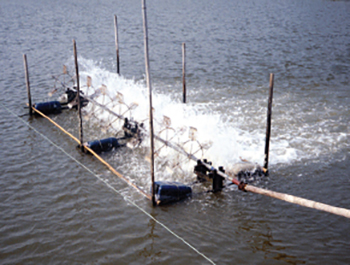
Although relatively expensive, mechanical aeration increases production. Asian-style paddlewheel aerators are widely used but are inefficient. Testing has led to more efficient designs that are now widely used in U.S. catfish and shrimp ponds.
Responsibility
The importance of water analysis in aquaculture
Proper monitoring of water quality in aquaculture production systems is critical to enable appropriate and timely management decisions. It requires reliable equipment, trained technicians that follow instructions and apply quality control measures, proper reagents and calibrated equipment, and appropriately collected water samples that are promptly analyzed.

Innovation & Investment
After half a century, Auburn’s Claude Boyd to ‘retire’
Friends, colleagues and former students of longtime Auburn University Professor Claude E. Boyd, Ph.D., don’t expect the Mississippi native to slow down, despite the quiet announcement of his retirement earlier this month. The 50-year veteran researcher’s career has been truly extraordinary.