Water quality standards: Total phosphorus
Through its Responsible Aquaculture Program, GAA has recommended a range of water quality standards for shrimp farm effluents. Part of a series, this article addresses total phosphorus.
Eutrophication of natural waters results from nutrient enrichment. When nutrient concentrations increase, resulting dense phytoplankton blooms cause low dissolved-oxygen concentrations in water and sediment. Since many species cannot tolerate low dissolved- oxygen concentrations, eutrophication can trigger a decline in biodiversity. The species that do well in eutrophic systems are blue-green algae, coarse fish, and other plants and animals generally considered undesirable by most users of coastal resources.
Two nutrient elements, nitrogen and phosphorus, are responsible for eutrophication in most instances. Phosphorus is usually the key factor, with nitrogen playing a secondary role.
https://www.aquaculturealliance.org/advocate/water-quality-standards-total-suspended-solids/
Phosphorus forms
Organic phosphorus is contained in living organisms and their particulate remains. Phosphorus also occurs in water in many forms. Dissolved phosphorus includes inorganic orthophosphate (H2PO4- or HPO4 2-) and phosphorus combined with dissolved organic matter.
In addition, suspended mineral soil particles contain phosphorus. Particulate phosphorus settles to the pond bottom and becomes a part of the sediment. Orthophosphate precipitates from water as calcium phosphate, and is strongly adsorbed by iron and aluminum compounds in acidic sediment.
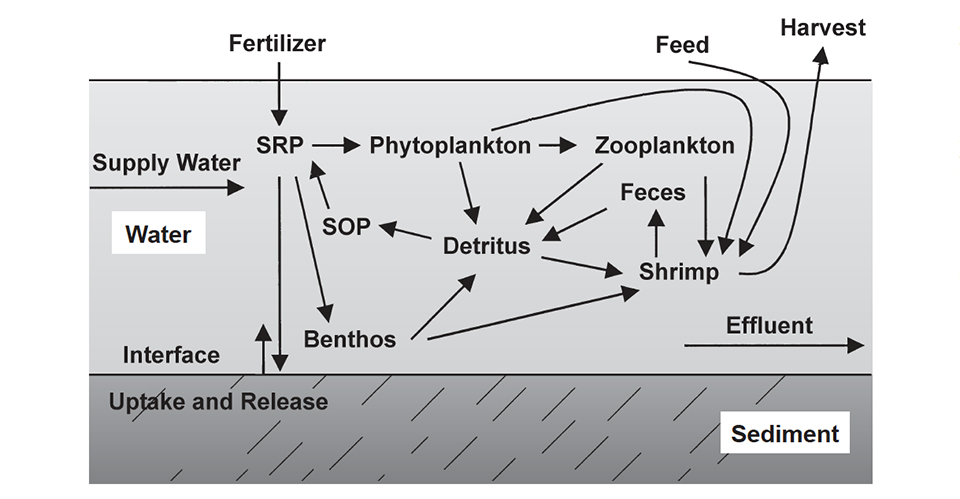
Shrimp pond dynamics
The dynamics of phosphorus in a shrimp pond are illustrated in Fig. 1 and Table 1. About 65 percent of the phosphorus applied to aquaculture ponds in fertilizer and feed ends up in the sediment in a highly insoluble form.
Boyd, Typical inputs and outputs of phosphorus, Table 1
| Phosphorus Inputs | Phosphorus Outputs |
|---|---|
| Feed 90% | Shrimp 25% |
| Inflowing Water 10% | Soil Uptake 65% |
| Effluent 10% |
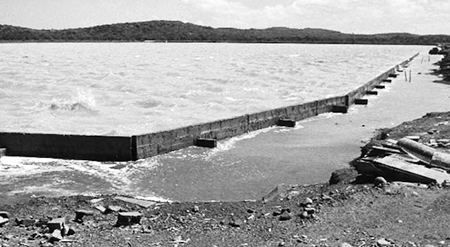
About 25 percent of the applied phosphorus is removed in harvest of the culture species. Thus, only around 10 percent of the phosphorus is discharged in effluent, mostly when ponds are drained for harvest. Storm overflow and waterexchange effluent carry much lower concentrations of phosphorus than the final 20-25 percent of water released when ponds are drained completely.
Analyses
Phosphorus analyses usually are made for total phosphorus and soluble reactive phosphorus. Soluble reactive phosphorus, the form most readily available to plants, consists primarily of orthophosphate. It generally comprises 10 to 15 percent of the total phosphorus.
The particulate organic phosphorus in water is converted to soluble reactive phosphorus by bacterial activity, but phosphorus contained in suspended soil particles is largely unavailable to organisms in ponds. Usually, about 50 percent of the particulate phosphorus is associated with organic matter and is potentially convertible to soluble reactive phosphorus.
Concentrations of soluble reactive phosphorus as low as 5 μg per liter have been reported to cause eutrophication in some estuaries and other coastal waters. Total phosphorus concentrations no greater than 0.05 to 0.1 milligrams per liter may be indicative of eutrophic waters.
Standards
The purpose of effluent standards for phosphorus is to reduce phosphorus loads to natural waters and prevent eutrophication. Phosphorus and nitrogen concentrations generally increase simultaneously in effluents, and procedures that lower phosphorus loads usually will reduce nitrogen loads. This is certainly the case in aquaculture ponds.
Soluble and total concentrations
Concentrations of soluble reactive phosphorus change rapidly in pond waters and stored water samples be cause of biological activity. Total phosphorus concentrations are more stable, and are thus a more reliable index of the phosphorus status of effluents and natural waters. Limits for total phosphorus concentration in effluent permits for non-aquaculture activities usually are 0.1 to 1.0 milligrams per liter.
GAA standard
The initial Global Aquaculture Alliance standard for total phosphorus was set at 0.5 milligrams per liter with a target standard of 0.3 milligrams per liter. These concentrations are thought to be low enough to prevent eutrophication in most coastal waters, but the median concentration of phosphorus in effluent data from several shrimp farms was 0.26 milligrams per liter. Thus, some shrimp farms likely will need to reduce total phosphorus concentrations in effluents to comply with the GAA standard.
High concentrations
High total phosphorus concentrations can be expected in the following situations: • Ponds with high stocking and feeding rates.
- Ponds with dense phytoplankton blooms.
- Ponds with high concentrations of suspended soil particles.
- Following heavy applications of phosphate fertilizer.
- Where farm water supplies already are eutrophic.
- In final effluent during pond draining.
Reducing concentrations
Methods for reducing total phosphorus concentrations in aquaculture ponds include the following:
- Use fertilizers in moderation and only when needed to promote phytoplankton growth.
- Do not stock and feed at rates so high that water quality deteriorates in ponds.
- Avoid feeding more than the culture species will consume.
- Purchase feeds that contain no more phosphorus than needed by the culture species.
- Reduce water exchange to encourage removal of excess phosphorus by sediment.
- Manage ponds to avoid excessive turbidity from suspended soil particles.
- Treat effluents by sedimentation to remove coarse suspended soil particles.
Changes in concentration
Total phosphorus does not change in concentration according to a daily cycle, as occurs with pH, dissolved oxygen, and some other water-quality variables. However, it can change quickly following fertilizer applications. It also can change over a few days in response to fluctuations in phytoplankton abundance or suspended-solids concentration.
When ponds are drained, the last 20 to 25 percent of pond effluent is particularly high in total phosphorus. Samples taken at weekly intervals usually provide a good record of the phosphorus status of effluents at a shrimp farm. These samples should be taken at the farm outfall just before effluents enter natural waters. Samples should be collected in plastic bottles, maintained on ice, and analyzed within 12 hours after collection.
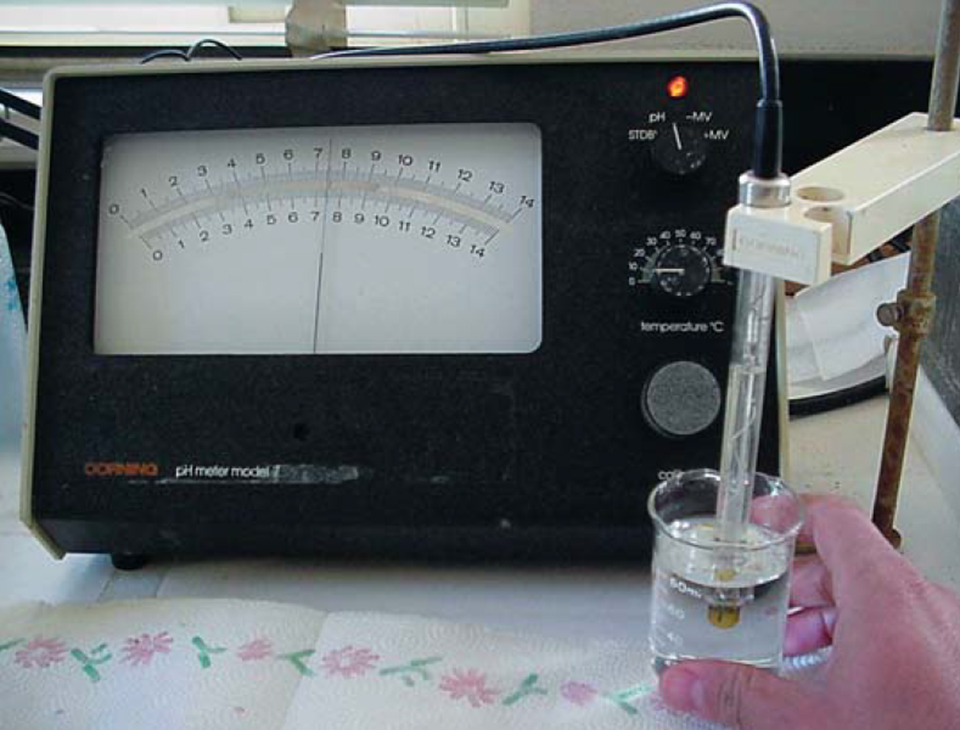
Analyses of total phosphorus require that water samples be digested in acid or with an oxidizing agent. This converts particulate phosphorus and soluble organic phosphorus to soluble orthophosphate that can be measured by spectrophotometry.
Testing
Shrimp farmers can contract with private or university laboratories to conduct phosphorus analyses. Because of the remoteness of many farms and the expense of custom water analyses, some farmers may want to make their own analyses. Hach Chemical Co. of Loveland, Colorado, USA sells a total phosphorus test procedure approved by the United States Environmental Protection Agency. Total phosphorus testing is also described in Standard Methods for Examination of Water and Wastewater and other manuals.
A procedure recently developed at Auburn University in Alabama, USA uses persulfate digestion to convert bound phosphorus to soluble orthophosphate. This method permits the measurement of both total nitrogen and total phosphorus in the same digestate. The protocol for this procedure will be provided upon request.
All procedures require a special apparatus for the digestion, reagents, and a spectrophotometer for analysis of orthophosphate. A trained technician must also be available for conducting the analyses. Some environmental agencies or lending institutions require shrimp farmers to measure soluble reactive phosphorus. The materials required for phosphorus analysis can also be used to make this measurement.
(Editor’s Note: This article was originally published in the June 2001 print edition of the Global Aquaculture Advocate.)
Now that you've reached the end of the article ...
… please consider supporting GSA’s mission to advance responsible seafood practices through education, advocacy and third-party assurances. The Advocate aims to document the evolution of responsible seafood practices and share the expansive knowledge of our vast network of contributors.
By becoming a Global Seafood Alliance member, you’re ensuring that all of the pre-competitive work we do through member benefits, resources and events can continue. Individual membership costs just $50 a year.
Not a GSA member? Join us.
Author
-

Professor, Department of Fisheries and Allied Aquacultures
International Center for Aquaculture and Aquatic Environments
Auburn University
Auburn, AL 36849 USA
Related Posts
Responsibility
Water quality standards: pH
The pH of shrimp pond water is influenced by source water, pH and acidity of bottom soil, shrimp culture inputs and biological activity.
Responsibility
Water quality standards: Total suspended solids
Solids in water are either in true solution or suspended. Suspended solids remain in suspension because they are so small and light.
Responsibility
Aquaculture ponds hold carbon
Although 16.6 million metric tons of carbon are annually buried in aquaculture ponds, estimated carbon emissions for culture species have approached several metric tons of carbon per metric ton of aquaculture product.
Responsibility
Copper treatments control phytoplankton
Copper sulfate is widely used as an algicide in ponds and other aquatic systems. Although copper quickly disappears from pond water, cupric ions can be harmful to aquatic animals.