Feed efficiency indicators for responsible aquaculture
Reducing FCR lowers feed costs and provides environmental benefits

Environmentally responsible, profitable aquaculture has its foundation in efficient resource use. Feed usually is the most costly item in aquaculture production. Fishmeal for aquaculture feeds is particularly expensive, and its supply from the oceans is limited. Some environmentalists are concerned about the growing amount of fishmeal used by the aquaculture industry, especially in the culture of species that need a high percentage of fishmeal in their diets. Moreover, a great dependence on fishmeal could lead to a future limit on the expansion of aquaculture.
Feed conversion ratio
Nearly all aquaculture producers use feed conversion ratios (FCRs) as an index of feed use efficiency. FCR is determined by dividing the total feed use in a production unit or entire aquaculture facility by the net production of the culture species.
FCRs vary with several factors, including species, feed type and quality, production system, feeding technique, and water quality conditions. Warmwater fish and shrimp farms typically achieve FCR values of 1.5 to 2.5, and for general purposes, FCR often is assumed to be 2.0.
Although FCRs are an excellent measure of feed use and economic efficiency, they can be misleading ecological indicators. For example, attainment of a 1.0 FCR does not imply that no wastes resulted from feeding.
Feeds typically contain about 90 percent dry matter and 10 percent water, while live fish and shrimp usually contain around 25 percent dry matter and 75 percent water. An FCR of 1.0 indicates that 1 kg of feed produced 1 kg fish or shrimp, but discounting moisture, 0.9 kg dry matter in feed produced only 0.25 kg dry matter in fish or shrimp. The dry matter FCR is 0.90 per 0.25, or only 3.6.
Put another way, the production of 1 kg live biomass resulted in 0.65 kg waste (0.90 kg dry matter in feed – 0.25 kg dry matter in biomass). The recovery of dry matter feed nutrients in harvested biomass was 27.8 percent at an FCR of 1.0. As feed-conversion ratios increase, the quantity of waste per kilogram of production increases, and the percentage of recovered feed nutrients in the harvested biomass decreases (Table 1).
Boyd, Relationships between feed conversion ratio (FCR) and waste production, Table 1
| FCR | Waste (kg/kg harvest biomass) | Feed Dry Matter Recovery in Harvest Biomass (%) | PCR | P.E. | FMCR | LFE |
|---|---|---|---|---|---|---|
| 2.50 | 2.00 | 11.1 | 0.88 | 4.49 | 0.75 | 3.38 |
| 2.25 | 1.78 | 12.3 | 0.79 | 4.04 | 0.68 | 3.06 |
| 2.00 | 1.55 | 13.9 | 0.70 | 3.59 | 0.60 | 2.70 |
| 1.75 | 1.32 | 15.9 | 0.61 | 3.14 | 0.52 | 2.34 |
| 1.50 | 1.10 | 18.5 | 0.52 | 2.69 | 0.45 | 2.02 |
| 1.25 | 0.88 | 22.2 | 0.44 | 2.24 | 0.38 | 1.71 |
| 1.00 | 0.65 | 27.8 | 0.35 | 1.80 | 0.30 | 1.35 |
Protein, fishmeal use
Protein, especially protein from fishmeal, is the most expensive component of aquaculture feeds. It also is the source of nitrogen in feeds and feeding wastes. There are possible economic and environmental benefits to feeds that contain no more protein and fishmeal than necessary. Several indexes can be useful in evaluating the efficient use of protein and fishmeal in aquaculture.
Protein conversion ratio
The protein conversion ratio (PCR) is the ratio of feed protein to net harvest biomass. It is calculated by multiplying FCR by the proportion of crude protein in feed as shown below:

The PCR for a feed conversion ratio of 2.0 using a 35 percent crude protein feed is 0.7. For the same feed protein content, PCR declines in direct proportion to declining FCR (Table 1).
Protein efficiency
Protein efficiency (P.E.) is estimated by multiplying FCR by the ratio of crude protein percentage in feed to that in the culture species as shown below:
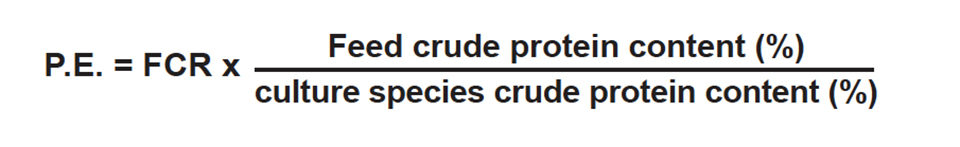
Protein efficiency is an estimate of the ratio of feed protein applied to protein contained in the net harvest biomass of the culture species. Live shrimp typically contain about 19.5 percent crude protein, while tilapia usually have a crude protein concentration of 14 percent. The P.E. for a shrimp farm where FCR is 2.0 and feed contains 35 percent crude protein is 2.0 (35 percent per 19.5 percent) = 3.63. Tilapia feeds often have about 30 percent crude protein, so for an FCR of 2.0, P.E. is 4.29 for tilapia.
P.E. obviously decreases with lower feed protein levels and larger percentages of whole-body protein in culture animals. Nevertheless, for the same feed and culture species, P.E. improves as FCR decreases (Table 1) for shrimp provided feed with 35 percent crude protein.
Fishmeal conversion
The fishmeal conversion ratio (FMCR) is the ratio of fishmeal in feed to net harvest biomass. It is calculated by multiplying FCR by the proportion of fishmeal in feed as follows:

Suppose a shrimp feed contains 30 percent fishmeal and FCR is 2.0. The FMCR is 2.0 x (30 percent per 100) or 0.6. Tilapia feeds contain about 8 percent fishmeal, and for FCR of 2.0, FMCR is 0.16. The benefit of lowering FCR on FMCR is illustrated in Table 1 for shrimp provided feed containing 30 percent fishmeal.
Live fish equivalence
Environmentalists often consider fishmeal in terms of the live fish equivalence (LFE) of the meal used in producing a unit weight of fish or shrimp. In marine fishmeal manufacturing, it requires 4-5 kg of live marine fish to give 1 kg fishmeal. Using a ratio of 4.5 kg fish to 1 kg fishmeal, the LFE can be calculated as follows:

In shrimp farming, an FCR of 2.0 attained with feed containing 30 percent fishmeal equates to an LFE of 2.70. For tilapia feed with 8 percent fishmeal and an FCR of 2.0, LFE is 0.72.
Benefits of reducing indexes
Reducing FCR at aquaculture production facilities lowers feed costs and provides environmental benefits. There is less waste per unit of production, and protein and fishmeal are conserved. Even greater benefits can be achieved if percentages of protein and fishmeal can be lessened without lowering feed quality and increasing FCR.
Assuming FCR is 1.75, PCR values for shrimp culture for different levels of feed protein are as follows: 38 percent protein, 0.66; 35 percent, 0.61; 32 percent, 0.56. Thus, it requires 100 kg less feed protein to produce 1 metric ton (MT) of shrimp when the feed crude protein level is lowered from 38 to 32 percent. The P.E. decreases from 3.41 to 2.87, improving the efficiency with which feed protein is converted to shrimp protein.
Suppose the fishmeal content of a shrimp feed can be decreased from 30 to 15 percent without altering the FCR of 1.75. The FMCR would decline from 0.52 to 0.26, and LFE from 2.34 to 1.17. The quantity of live fish needed to make fishmeal for feed to produce 1,000 kg live shrimp would decline from 2,340 kg to 1,170 kg.
It is noteworthy that shrimp culture often requires a greater amount of marine fish for fishmeal in feed than it yields in shrimp. This is an example of why some environmental groups claim that certain types of aquaculture detract from rather than add to world fisheries production.
Comparison: shrimp, tilapia
A comparison of shrimp culture and tilapia culture using the variables discussed above illustrates significant differences related to fishmeal use in feed (Table 2). This is a major reason tilapia production usually is considered more environmentally friendly than shrimp production.
Boyd, Comparison of feed use efficiency, Table 2
| Variable | Shrimp (Penaeus monodon) | Tilapia |
|---|---|---|
| Feed conversion ratio | 1.75 | 1.75 |
| Feed crude protein content (%) | 35 | 30 |
| Fishmeal content of feed (%) | 30 | 8 |
| Waste (kg/kg harvest biomass) | 1.32 | 1.32 |
| Feed dry matter recovery in harvest biomass (%) | 15.9 | 15.9 |
| Protein conversion ratio | 0.61 | 0.52 |
| Protein equivalence | 3.14 | 3.75 |
| Feed meal conversion ratio | 0.52 | 0.14 |
| Live fish equivalence | 2.34 | 0.63 |
Two major factors that can improve the efficiency of aquaculture and provide environmental benefits are the use of high-quality feeds and good feeding practices that lower FCR and reduce the percentage of fishmeal in feeds.
(Editor’s Note: This article was originally published in the December 2005 print edition of the Global Aquaculture Advocate.)
Now that you've reached the end of the article ...
… please consider supporting GSA’s mission to advance responsible seafood practices through education, advocacy and third-party assurances. The Advocate aims to document the evolution of responsible seafood practices and share the expansive knowledge of our vast network of contributors.
By becoming a Global Seafood Alliance member, you’re ensuring that all of the pre-competitive work we do through member benefits, resources and events can continue. Individual membership costs just $50 a year.
Not a GSA member? Join us.
Author
-

Department of Fisheries and Allied Aquacultures
Auburn University
Alabama 36849 USA
Related Posts

Innovation & Investment
After half a century, Auburn’s Claude Boyd to ‘retire’
Friends, colleagues and former students of longtime Auburn University Professor Claude E. Boyd, Ph.D., don’t expect the Mississippi native to slow down, despite the quiet announcement of his retirement earlier this month. The 50-year veteran researcher’s career has been truly extraordinary.
Responsibility
Calcium and magnesium use in aquaculture
Aquatic plants and animals get the essential nutrients calcium and magnesium from water and food. Calcium concentrations impact the hydration and development of eggs in a hatchery, where calcium carbonate precipitation can be troublesome.
Responsibility
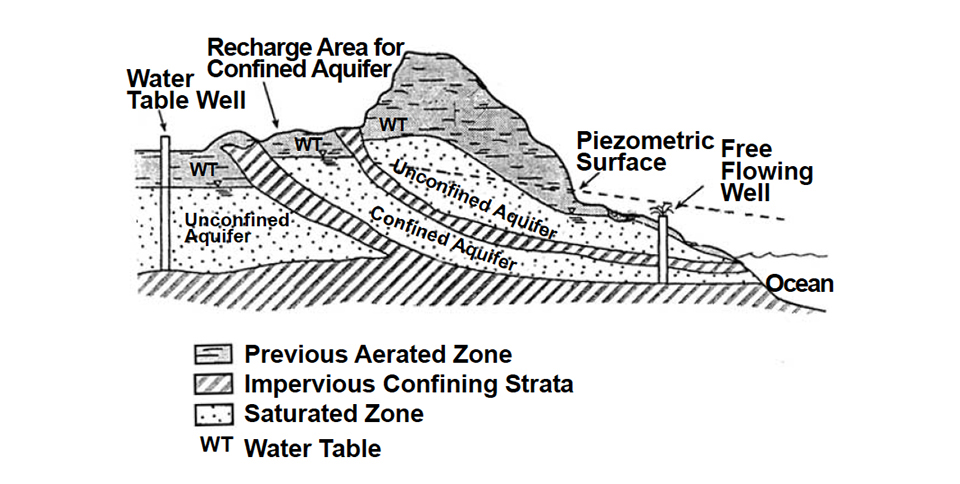
Groundwater and wells
Groundwater from wells is sometimes used to supply hatcheries and ponds. The potential water supply via wells is defined largely by geology.
Responsibility
Drying, liming, other treatments disinfect pond bottoms
The traditional way of destroying organisms in pond bottoms is thorough dry-out for a week or longer. Fish toxicants and liming can kill unwanted parasites.