Genetic screening in Nile tilapia
Multiplex microsatellite, AFLP marker analyses provide inexpensive screening
The fact that domesticated fish stocks contain only a fraction of the natural genetic diversity of a species is the most critical constraint for any commercial-scale selection program. As the scope of any selective breeding is to fix a subset of positive allelic variants available in the base population, it is of paramount importance to secure a vast allelic repertoire in such a population before it is genetically isolated at the start of the project
This is a sensitive requirement, especially in cases of alien species introduced for aquaculture, which are often small stocks of unchecked lineage and, hence, exposed to founder effects. This is true for most of the introductions of Nile tilapia (Oreochromis niloticus) and its interspecific hybrids in Asia, Central America, and South Americas, with the possible exception of the internationally sponsored 10-year GIFT project in the Philippines.
At present, it is uncertain how genetically divergent farmed Nile tilapia strains are, and how strain crossbreeding could eventually take advantage of their genetic complementarity to assemble a base population for selection. Equally unclear is whether interspecific Nile tilapia hybrids – which are viable, fertile, and sometimes skewed toward males – can be used to construct a genetically polymorphic hybrid stock for performance improvement. The monitoring of broodstock genetic variation is an essential element in avoiding deterioration of the genotypic and phenotypic qualities of the domesticated population by unintentional selection and inbreeding depression.
Genetic markers
In the past, assessment of genetic variability was inferred from allozyme or other protein marker analysis. The process was simple and cheap, but biased by the fact that many allelic differences are not translated into electrophoretic mobility shifts.
Today, several methods based on polymerase chain reaction (PCR) for direct DNA genotyping scan not only RNA- and protein-encoding sequences, but also noncoding DNA regions such as microsatellites and introns. These are not manifested phenotypically and, being unconstrained by natural selection, can accumulate more mutations than coding DNA does.
Microsatellite markers
Microsatellites are tandem nucleotide repeats of two to six bases which, at the extremes, are flanked by unique sequences. Polymorphism at a given microsatellite site or locus is due to variation in the number of repeats, while the repeated simple sequence is usually conserved.
In unilocus analysis, specific primers are designed on both border regions encompassing the microsatellite end and the beginning of the flanking segment. The PCR signal appears as one or two bands when one (homozygous) or two (heterozygous) variants or alleles of the microsatellite are present, respectively. Microsatellite inheritance is Mendelian, codominant, and supposedly neutral. No signal is sometimes received when nucleotide changes occur in the primed flanking segment.
AFLP markers
Another useful technique to probe genetic diversity is amplified fragment length polymorphism (AFLP) multilocus analysis. AFLP markers are PCR-amplified restriction fragments of genomic DNA digested with two endonucleases, like EcoRI and MseI.
Before amplification, an arbitrary DNA sequence or adapter is ligated to both ends of each fragment, and primers are designed to include a section complementary to the adapter to help annealing. This is followed by one complementary to the known restriction site, where the real fragment begins or ends, and a sequence of a few randomly chosen nucleotides. From here, extension occurs if the chosen bases happen to be complementary to those in the template.
The PCR signal appears as a pattern of bands corresponding to those fragments providing an exact match to the primers. Those that do not, fail to give a band. AFLP markers seem to be transmitted as haplotypes, because heterozygous loci bearing nucleotide differences in the chosen base pairs (no band) or internal portion of the amplificate (a different band) are difficult to recognize. However, they are highly polymorphic and provide an excellent coverage over the entire genome with no need for prior sequence knowledge.
Marker analyses
Since microsatellite and AFLP analyses are three to four times more expensive than allozyme assays, the authors adopted a multiplex approach to cut costs and speed up the procedure.
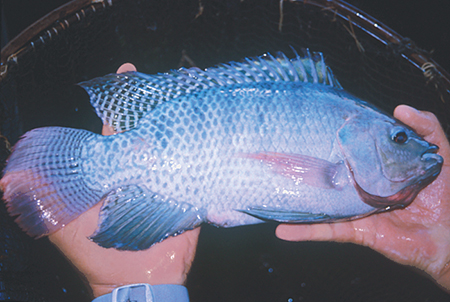
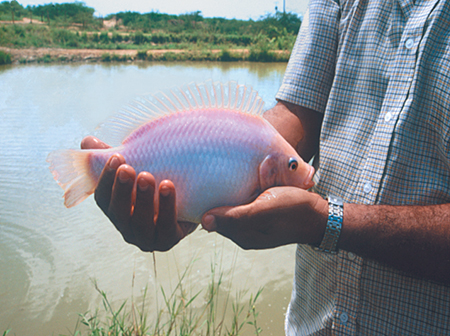
These techniques were applied to examine the genetic variability, heterozygosity, conformity to Hardy-Weinberg equilibrium, and genetic structure of a “Chitralada” Nile tilapia strain (n = 77) imported to Brazil from Thailand in 1997; a “Pink Koina” hybrid tilapia strain (n = 30) imported to Brazil from Florida, USA, in 1995; and/or their two-way crossbreds (n = 30 each). Specimens of both strains and crossbreds were obtained from farms near Petrolina, Pernambuco, Brazil.
Microsatellite marker analysis
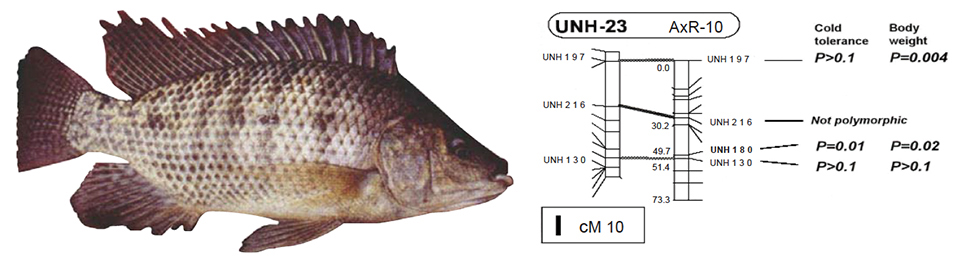
For microsatellite analysis, two pen-taplex PCR reactions were designed to coamplify 5 loci/assay: loci Os-7R, UNH-192, UNH-231, Os-25, and UNH-151 in the first assay and loci OS-7, UNH-207, UNH-213, UNH-160, and UNH-169 in the second assay. To distinguish products with overlapping sizes, each pentaplex PCR reaction was performed using two primer sets 5’-labeled with 6-Fam dye and three prim-er sets 5’-labeled with Hex dye.
AFLP marker analysis
AFLP markers were obtained after EcoRI/MseI digestion of genomic DNA and fragment amplification using five primer combinations with two and three selective nucleotides in the forward and reverse primers, respectively. The forward primers were 5’-labeled with Hex, 6-Fam, or Tamra dyes to perform triplex assays. Electrophoresis of both microsatellite and AFLP products was carried out with an automatic DNA sequencer, with data analyzed using GENESCAN, GENEPOP, and ARLEQUIN softwares.
Results
A total of 96 alleles were found in the 10 microsatellite loci analyzed, with Os-7R showing the most polymorphic pattern (14 alleles). Observed heterozygosity of the Chitralada and Pink Koina broodstocks was 36.4 and 37.7 percent, respectively, but increased to 46.5 percent and 60.0 percent in their F1 crossbreds. Lower inbreeding coefficient values were found in both crossbreds (0.29 and 0.08 in female Pink Koina x Chitralada and Chitralada x Pink Koina crosses, respectively) compared to parental stocks (0.40 in Chitralada and 0.34 in Pink Koina), as expected when distinct parental strains are crossed.
AFLP analysis was limited to the Chitralada and Pink Koina strains (n = 12 each). A total of 686 unique fragments were detected, of which 68 fragments (9.9 percent) were polymorphic AFLP markers. The number of AFLP variants per primer pair varied 6-25, with an average of 13.6 AFLP markers/primer pair.
The mean GST values, expressing genetic diversity for both microsatellite and AFLP markers, revealed a concordant distribution of variation in the Chitralada and Pink Koina strains, with the majority of genetic diversity contained within populations (microsatellites: 82.5 percent, AFLPs: 92.8 percent; P < 0.01) rather than among populations. This was remarkable, as Chitralada is considered a monospecific strain, while Pink Koina is an interspecific hybrid strain.
Conclusion
These results indicated that both microsatellite and AFLP marker analyses performed with a multiplex approach can provide adequate screening of genetic diversity in tilapia stocks at a low cost (U.S. $2.50 per microsatellite marker in pentaplex, $9.04 per AFLP marker in triplex) and with limited labor due to semiautomation. Thus, they can be conveniently applied to assemble highly polymorphic base populations for selective breeding to check parental ascendance, avoid mating of relatives in selected broodstock management, prove homozygosity in mitogynogenetic and androgenetic clonal founders, genotype pure lines and isogenic clones, and estimate genetic divergence among tilapia strains cultured in different parts of the world.
(Editor’s Note: This article was originally published in the December 2003 print edition of the Global Aquaculture Advocate.)
Now that you've reached the end of the article ...
… please consider supporting GSA’s mission to advance responsible seafood practices through education, advocacy and third-party assurances. The Advocate aims to document the evolution of responsible seafood practices and share the expansive knowledge of our vast network of contributors.
By becoming a Global Seafood Alliance member, you’re ensuring that all of the pre-competitive work we do through member benefits, resources and events can continue. Individual membership costs just $50 a year.
Not a GSA member? Join us.
Authors
-

Department of Biology
University of Padova
v. G. Colombo, 3
35121 Padova, Italy -
Department of Biology
University of Padova
v. G. Colombo, 3
35121 Padova, Italy
Related Posts
Health & Welfare
A look at aquaculture genomics
Advances in genomics assist aquaculture science by deepening the understanding of adaptation, physiology and quantitative genetics.
Health & Welfare
Barcoding, nucleic acid sequencing are powerful resources for aquaculture
DNA barcoding and nucleic acid sequencing technologies are important tools to build and maintain an identification library of aquacultured and other aquatic species that is accessible online for the scientific, commercial and regulatory communities.
Health & Welfare
Biosecurity principles for sustainable production using SPF shrimp
Basic components of biosecurity include knowledge of diseases, adequate detection methods and the use of “clean” shrimp stocks.
Responsibility
‘Model’ tilapia venture shows mettle in Mozambique
On the shores of Lake Cahora Bassa, Chicoa Fish Farm hopes to create a ripple effect to improve fish supply and quality of life for an impoverished region.