Study: Lower biofloc concentration may improve shrimp production
No significant differences in survival, FCR or final biomass
Biofloc-based shrimp culture systems typically undergo little if any water exchange, and can support high animal densities with minimum mechanical filtration. The dense microbial community that develops in these systems is responsible for detoxifying otherwise harmful nitrogen compounds and can also supply supplemental nutrition for shrimp. The microbial community is partially contained within biofloc particles, and some control over the concentration of these particles is necessary and likely helps to prevent issues such as anaerobic sludge deposition, gill clogging and excessive microbial oxygen demand.
To examine the effects of biofloc concentration, the authors conducted an experiment evaluating two levels of biofloc concentration management in mesohaline, commercial-scale shrimp culture systems.
Culture systems
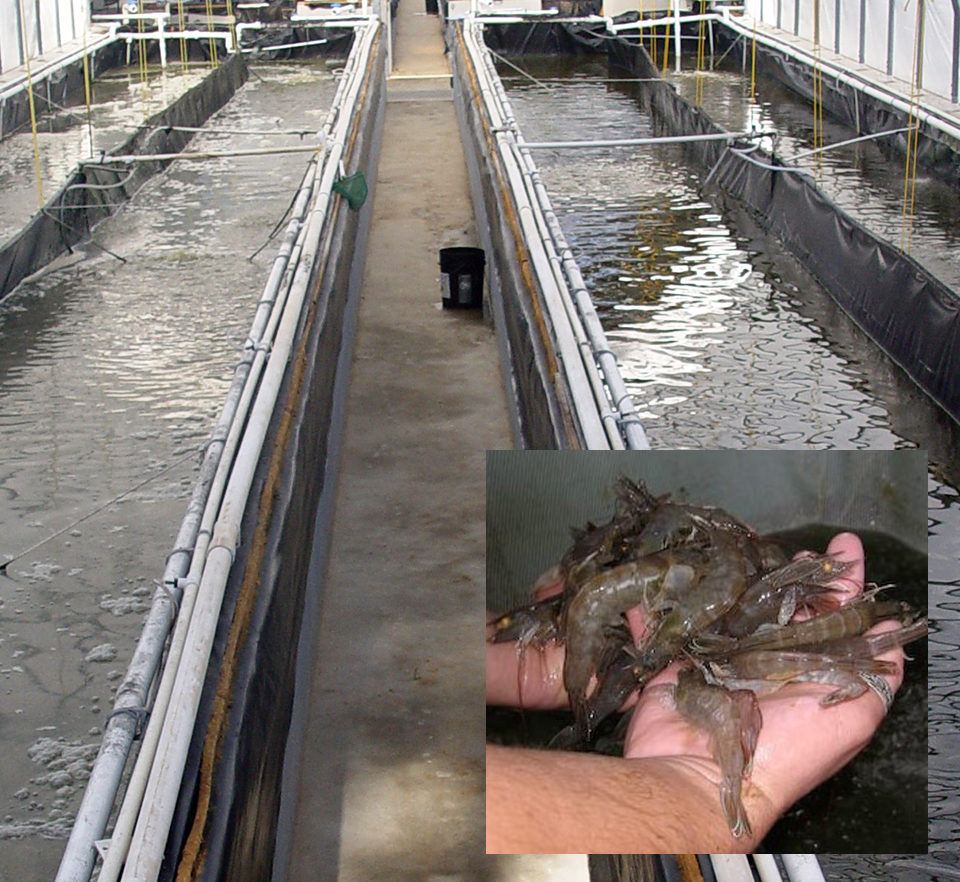
Litopenaeus vannamei shrimp were grown in a nursery until they weighed an average of 0.7 grams, at which point they were stocked into eight 3.2- x 30.1- x 0.5-m raceways at a density of 250 shrimp per cubic meter. Contained under greenhouse structures, the raceways were made of concrete blocks lined with plastic. Water was maintained at a salinity of approximately 16 ppt. Water was propelled around a central wall using a pump connected to Venturi nozzles and four airlift mechanisms. As needed, pure oxygen gas was injected into the raceways through the Venturi nozzles. Shrimp were grown for 13 weeks.
Two treatments were created, each with four randomly assigned raceways. A low-solids treatment (T-LS) was designed to have a relatively lower biofloc concentration than a high-solids treatment (T-HS). Raceways in the low-solids treatment had 1,700-L cone-bottom settling chambers adjacent to them that operated at a flow rate of 20 lpm. Raceways in the high-solids treatment had 760-settling chambers operated at a flow rate of 10 lpm.
Water was transported to the settling chambers using the same pump that helped to circulate water in the raceways. The water traveled down a large pipe suspended in the center of each settling chamber, causing velocity to slow. Settled material collected at the bottoms of the chambers, and clarified water flowed out near the top. Settled material was drained once weekly.
Granulated sucrose (household table sugar) was added to each raceway several times per day to stimulate the uptake of nitrogen by heterotrophic bacteria. During the study, each raceway received 353.5 kg of feed and 184.3 kg of sucrose (wet weights). The combined carbon:nitrogen ratio of these inputs was 12.4:1. The 35 percent-protein feed was broadcast by hand throughout the raceways five times daily.
Water quality
An average of 10.3 cubic meters of material was removed from each low-solids treatment raceway and 8.0 cubic meters was removed from each high-solids treatment raceway. The average total dry weights of that material were 268.7 kg for T-LS raceways and 156.7 kg for T-HS raceways.
Ray, Mean water quality parameters, Table 1
| T-LS Raceways | T-LS Settling Chambers | T-HS Raceways | T-HS Settling Chambers | |
|---|---|---|---|---|
| Total suspended solids (mg/L) | 196.8 ± 15.3 | 98.1 ± 11.0 | 313.0 ± 17.0 | 122.5 ± 10.4 |
| Volatile suspended solids (mg/L) | 131.9 ± 7.9 | 70.2 ± 12.0 | 248.1. ± 15.1 | 82.5 ± 11.6 |
| Turbidity (NTU) | 43.8 ± 2.8 | 19.1 ± 2.0 | 105.6 ± 9.9 | 68.6 ± 12.5 |
| Ammonia (mg total ammonia nitrogen/L) | 1.5 ± 0.4 | 2.1 ± 0.3 | 0.4 ± 0.1 | 1.5 ± 0.3 |
| Nitrite (mg nitrite nitrogen/L) | 2.5 ± 0.4 | 2.1 ± 0.5 | 3.2 ± 0.4 | 3.0 ± 0.4 |
| Nitrate (mg nitrate nitrogen/L) | 0.4 ± 0.3 | 0.4 ± 0.2 | 7.1 ± 1.3 | 6.2 ± 1.2 |
| Orthophosphate (mg phosphate/L) | 39.9 ± 3.1 | 31.3 ± 2.2 | 33.6 ± 2.3 | 29.4 ± 1.9 |
| Alkalinity (mg calcium carbonate/L) | 294.3 ± 3.9 | 302.5 ± 4.3 | 278.2 ± 4.4 | 287.7 ± 4.9 |
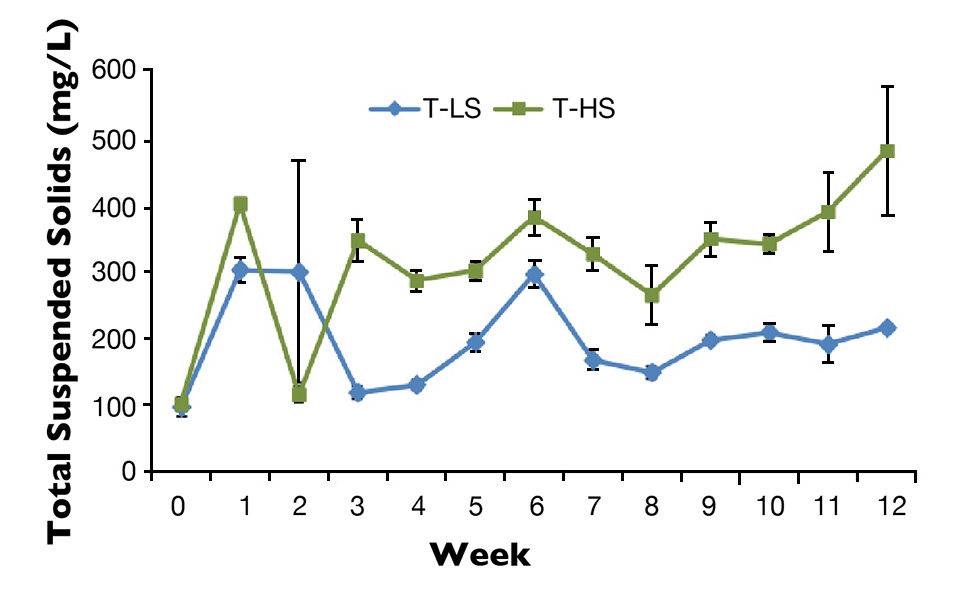
Temperature, dissolved oxygen and pH remained within acceptable ranges for the growth of L. vannamei. Table 1 provides the water quality parameters measured in the raceways and the water returning to the raceways from the settling chambers. As intended, total suspended solids (TSS) concentrations were significantly lower in the T-LS raceways compared to the T-HS raceways (Fig. 1).
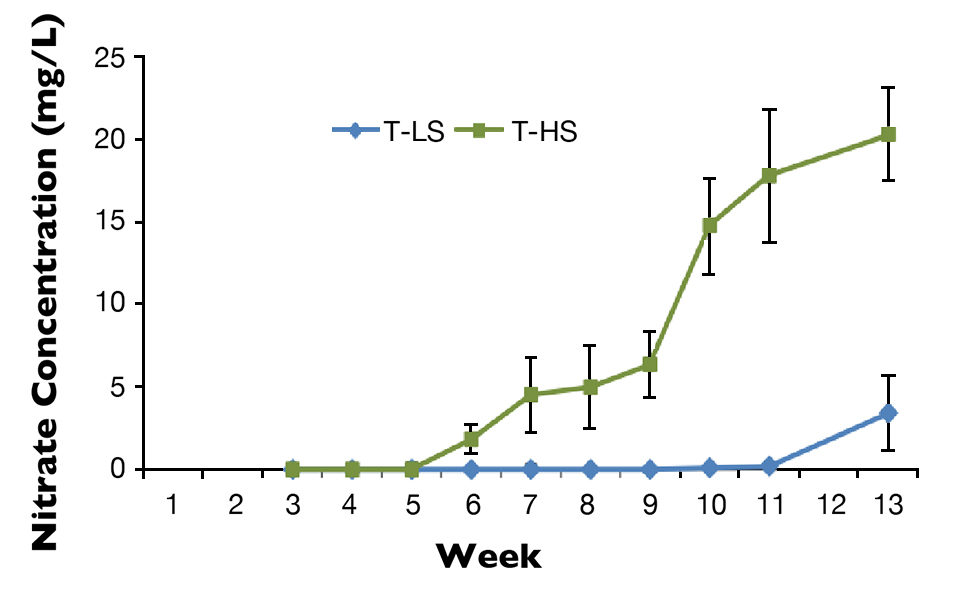
Volatile suspended solids (VSS) concentrations, turbidity, nitrite concentrations and nitrate concentrations were also significantly lower in the T-LS raceways than the T-HS raceways. Ammonia, phosphate and alkalinity concentrations were each significantly lower in the T-HS raceways. Ammonia and nitrite concentrations tended to fluctuate in both treatments over the course of the experiment. Nitrate concentrations (Fig. 2) continually increased in the T-HS treatment beginning in week 6. However, nitrate never accumulated appreciably in the T-LS raceways.
Settling chamber effects
The settling chambers in both treatments significantly reduced TSS, VSS and turbidity (Table 1). They also returned a significantly greater concentration of ammonia to the raceways than entered the chambers. There were significantly lower concentrations of nitrite in the water returning from the settling chambers in both treatments.
There was no significant difference in nitrate concentration between water entering and water exiting the settling chambers in the T-LS systems, and the nitrate concentrations were low in these systems to begin with. However, the T-HS settling chambers returned significantly lower concentrations of nitrate than what entered them. The chambers in both treatments returned significantly greater concentrations of phosphate and alkalinity than the values in the water that entered them.
Shrimp production
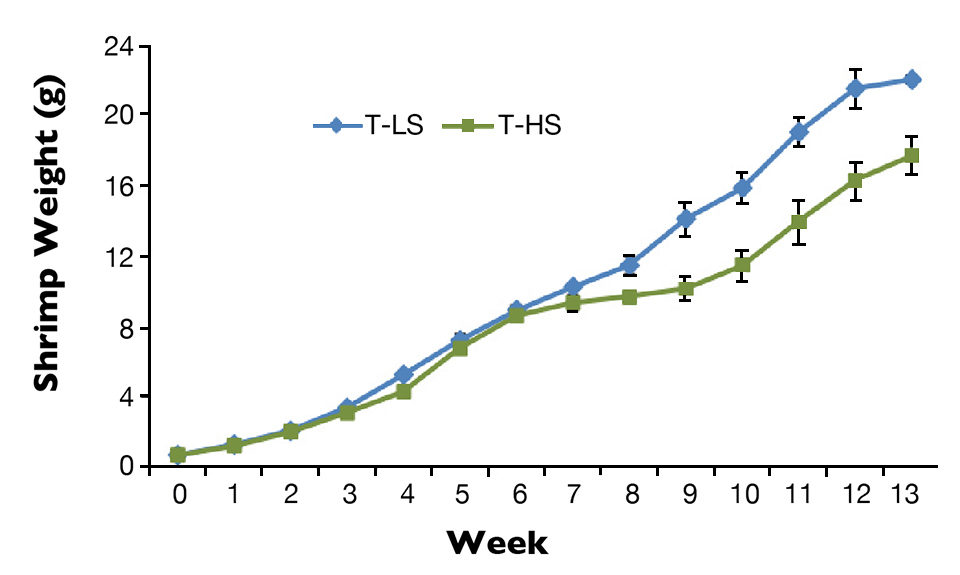
Shrimp in the T-LS raceways grew significantly faster in the study – an average of 1.7 grams per week, while shrimp in the T-HS raceways grew 1.3 grams per week (Fig. 3). T-LS shrimp had an average weight of 22 grams, while shrimp in the T-HS raceways had an average weight of 18 grams at the end of the study. There were no significant differences in survival, feed-conversion ratio (FCR) or final shrimp biomass between treatments. Average survival was 50 and 49 percent, FCR was 2.5 and 3.3, and biomass was 2.8 and 2.2 kg per cubic meter in the T-LS and T-HS raceways, respectively.
Perspectives
Flow rates of 10 versus 20 lpm to the settling chambers created significantly different concentrations of biofloc in the raceways. The settling chambers were also different in size, although this did not appear to have as large an effect as flow rate. The retention times of the chambers were similar at 85 minutes in the 1,700-L, T-LS chambers and 76 minutes in the 760-L, T-HS chambers.
All settling chambers generated a significant amount of ammonia. They reduced nitrite, reduced nitrate in the T-HS treatment and increased alkalinity and phosphate. Denitrification may have occurred in the settling chambers based on the reduction of nitrate and increase of alkalinity, although the corresponding increase of phosphate is unusual in the denitrification process.
Nitrification apparently occurred in the T-HS raceways based on the accumulation of nitrate. However, even though the same amount of sucrose was added to all raceways to promote heterotrophic nitrogen assimilation, there was no substantial increase of nitrate concentration in the T-LS raceways. What caused this? Firstly, the biofloc concentration may have been so low that inadequate surface area existed for nitrifying bacteria. Also, algae may have assimilated the nitrate, or denitrification may have occurred at a rapid rate in the T-LS settling chambers.
Shrimp survival was low during this study. This was likely the result of high nitrite concentrations at the end of the nursery phase. Shrimp coming from the nursery appeared lethargic, and many likely died near the beginning of the study. This led to an overestimation of the shrimp population, overfeeding and the resulting high FCRs. However, with a growth rate of 1.7 grams per week and final weight of 22 grams, the low-solids treatment performed well overall.
(Editor’s Note: This article was originally published in the March/April 2012 print edition of the Global Aquaculture Advocate.)
Authors
-

Department of Coastal Sciences
Gulf Coast Research Laboratory
University of Southern Mississippi
703 East Beach Drive
Ocean Springs, Mississippi 39564 USA -
Department of Coastal Sciences
Gulf Coast Research Laboratory
University of Southern Mississippi
703 East Beach Drive
Ocean Springs, Mississippi 39564 USA
Related Posts
Aquafeeds
Biofloc consumption by Pacific white shrimp postlarvae
The stable isotopes technique with δ13C and δ15N can be used to determine the relevance of different food sources to shrimp feeding during the pre-nursery phase of Litopenaeus vannamei culture. During this trial, different types of commercial feed, microalgae, Artemia sp. nauplii and bioflocs were used as food sources.
Responsibility
Biofloc technology options for aquaculture
Biofloc technology offers advantages for the sustainable culture of shrimp and some species of fish.
Health & Welfare
Biofloc technology: Possible prevention for shrimp diseases
Facing emerging viral problems and rising energy costs, the use of biofloc technology in biosecure systems offers an answer for sustainable shrimp aquaculture. The main attributes of biofloc systems in reducing disease risk include the fact that low water exchange improves pathogen exclusion.
Intelligence
Biofloc technology production promising in temperate zones
A study was conducted to assess the feasibility to grow Channel catfish (Ictalurus punctatus) in an outdoor biofloc system during winter in a temperate zone. High biomasses of market-size channel catfish were successfully maintained through the winter with high survival and in good condition in both treatments.